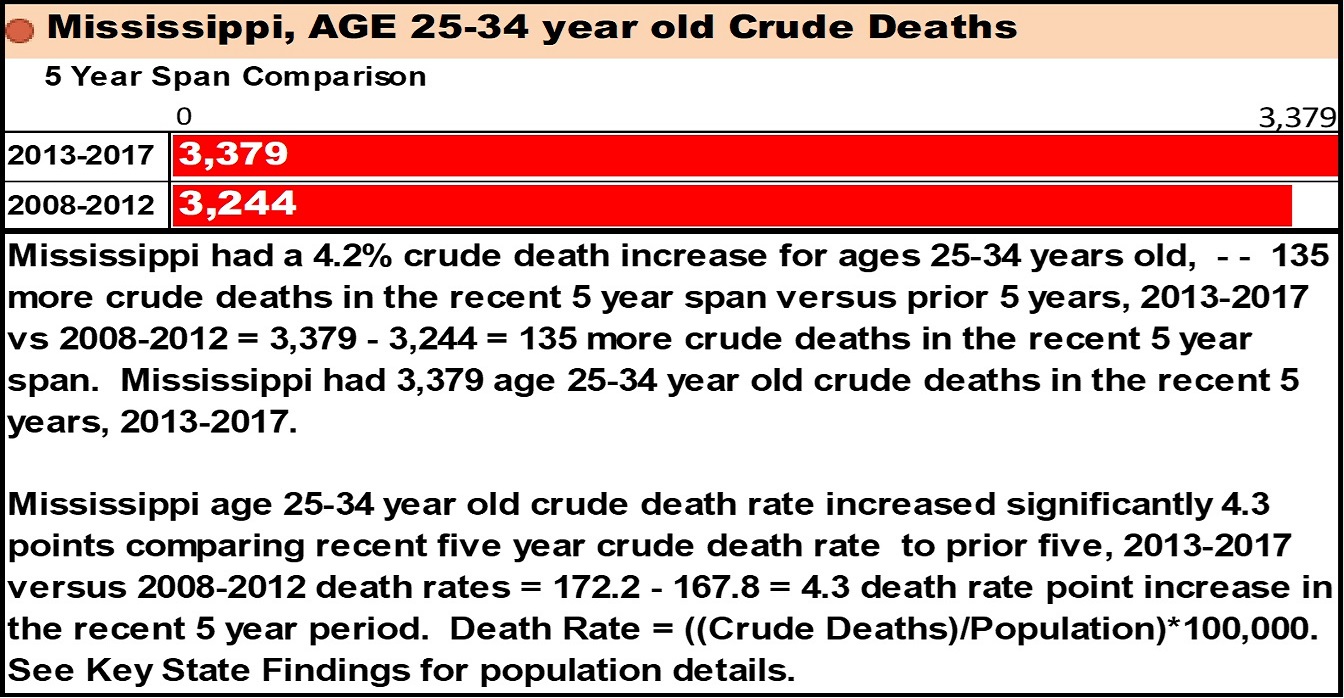
Mississippi had a 4.2% crude death increase for ages 25-34 years old, - - 135 more crude deaths in the recent 5 year span versus prior 5 years, 2013-2017 vs 2008-2012 = 3,379 - 3,244 = 135 more crude deaths in the recent 5 year span. Mississippi had 3,379 age 25-34 year old crude deaths in the recent 5 years, 2013-2017.
Mississippi age 25-34 year old crude death rate increased significantly 4.3 points comparing recent five year crude death rate to prior five, 2013-2017 versus 2008-2012 death rates = 172.2 - 167.8 = 4.3 death rate point increase in the recent 5 year period. Death Rate = ((Crude Deaths)/Population)*100,000. See Key State Findings table for population details.
Calculation for Percent Change = ((New Value - Old Value)/ Old Value )*100 = 4.2% = Mississippi ((2013-2017 Crude deaths - 2008-2012 Crude deaths ) / (2008-2012 Crude deaths ))*100 = ((3,379 - 3,244) / ( 3,244))*100 = ((135) / ( 3,244))*100 = 4.2%
Ages 25-34 years old, crude Death Rates by state, 2013-2017, five year span, U.S. Map
Eastern states (e.g., Michigan and Ohio) tend to have higher age 25-34 year old death rates than the U.S. age 25-34 year old death rate '118.8' indicated by o
o = red circle indicates state crude death rate is greater than U.S. age 25-34 year old crude DR 118.8.
p = red triangle indicates a top 15 state struggling with high age 25-34 year old death increase in the recent five year period, 2013-2017.
Crude DR (Death Rate) = (crude deaths/population) x 100,000 = U.S. Crude DR for ages 25-34 during 2013-2017 = ((261,988) / (220,518,208)) * 100,000 = 118.8
There were 118.8 crude deaths per 100,000 people age 25-34 years old in the U.S. during the recent five year span 2013-2017.
Crude death is a measure of all death for a specified period and age group.
Ages 25-34 years old, crude Death Rates by state, 2013-2017, five year span, U.S. Map
Eastern states (e.g., Michigan and Ohio) tend to have higher age 25-34 year old death rates than the U.S. age 25-34 year old death rate '118.8' indicated by o o = red circle indicates state crude death rate is greater than U.S. age 25-34 year old crude DR 118.8.
p = red triangle indicates a top 15 state struggling with high age 25-34 year old death increase in the recent five year period, 2013-2017.
Crude DR (Death Rate) = (crude deaths/population) x 100,000 = U.S. Crude DR for ages 25-34 during 2013-2017 = ((261,988) / (220,518,208)) * 100,000 = 118.8
There were 118.8 crude deaths per 100,000 people age 25-34 years old in the U.S. during the recent five year span 2013-2017.
Crude death is a measure of all death for a specified period and age group.


How much did age 25-34 crude deaths increase in the in the U.S. in the recent five year period, 2013-2017, compared to the prior five years, 2008-2012, is this significant?
Answer: U.S. young adults ages 25-34 years old had a 21.6% crude death increase - - 46,613 more crude deaths in the recent 5 Year Span vs prior 5 years, 2013-2017 vs 2008-2012 = 261,988 - 215,375 = 46,613 more crude deaths in the recent 5 Year Span. U.S. young adults ages 25-34 years old had 261,988 crude deaths in the recent five years, 2013-2017!
U.S young adults ages 25-34 years old crude death rate increased significantly 14.3 points comparing recent five year crude death rate to prior five years, 2013-2017 vs 2008-2012 death rates = 118.8 - 104.5 = 14.3 death rate point increase in the recent five year period!

Note: It is out of character for ages 25-34 years old, to have significant death increase. It is not normal for a young healthy age group to have a significant death increase. Normally this age group stays relatively the same, goes up or down a point or two, it should go down considering all the technology and safety electronics we have. The U.S. having a 14.3 death rate point increase, is a horrific significant change in death in a normally healthy young age group, ages 25-34 years old! To better understand this significance, look at mind-altering substance deaths for this population in the same period U.S. substance deaths by state https://hiskingdomwematter.blogspot.com/p/us-age-25-34-year-old-substance-deaths.html and Mississippi substance deaths https://hiskingdomwematter.blogspot.com/p/mississippi-us-ages-25-34-year-old.html.
Deaths lost per day

Answer: U.S. young adults ages 25-34 years old had a 21.6% crude death increase - - 46,613 more crude deaths in the recent 5 Year Span vs prior 5 years, 2013-2017 vs 2008-2012 = 261,988 - 215,375 = 46,613 more crude deaths in the recent 5 Year Span. U.S. young adults ages 25-34 years old had 261,988 crude deaths in the recent five years, 2013-2017!
U.S young adults ages 25-34 years old crude death rate increased significantly 14.3 points comparing recent five year crude death rate to prior five years, 2013-2017 vs 2008-2012 death rates = 118.8 - 104.5 = 14.3 death rate point increase in the recent five year period!
Calculation for Percent Change (%Death increase/decrease) = ((New Value - Old Value)/ Old Value )*100 = 21.6% = 25-34 years ((2013-2017 Crude deaths - 2008-2012 Crude deaths ) / (2008-2012 Crude deaths ))*100 = ((261,988 - 215,375) / ( 215,375))*100 = ((46,613) / ( 215,375))*100 = 21.6% crude death increase for ages 25-34 years old.
Note: It is out of character for ages 25-34 years old, to have significant death increase. It is not normal for a young healthy age group to have a significant death increase. Normally this age group stays relatively the same, goes up or down a point or two, it should go down considering all the technology and safety electronics we have. The U.S. having a 14.3 death rate point increase, is a horrific significant change in death in a normally healthy young age group, ages 25-34 years old! To better understand this significance, look at mind-altering substance deaths for this population in the same period U.S. substance deaths by state https://hiskingdomwematter.blogspot.com/p/us-age-25-34-year-old-substance-deaths.html and Mississippi substance deaths https://hiskingdomwematter.blogspot.com/p/mississippi-us-ages-25-34-year-old.html.
Deaths lost per day
The U.S. lost young people ages 25-34 years old to a death at the rate of 143.5 deaths per day during 2013-2017 = 261,988 crude deaths / 5 years = 52,397.6 deaths per year / 365 days per year = 143.5550684932 crude deaths per day during years 2013-2017.
Which age group had the largest increase in crude deaths in the U.S. in the last 5 year span 2013-2017 compared to the prior 5 years?
Answer: The ten-year age group, ages 25-34 years had the largest increase in crude death in the last five year span, ages 25-34 years old had significant, 21.6% increase in crude deaths, 2013-2017 versus the five years prior 2008-2012!
Answer: The ten-year age group, ages 25-34 years had the largest increase in crude death in the last five year span, ages 25-34 years old had significant, 21.6% increase in crude deaths, 2013-2017 versus the five years prior 2008-2012!
Age Division % Change (Age Group Comparison
In U.S., in the recent five year span, 2013-2017, we see a significant increase in crude death for persons aged 15-24 years old, compared to earlier age group age 5-14 years old, we see a 463% increase in crude death for persons aged 15-24 years old, compared to earlier age group age 5-14 years old. There were 125,296 more crude deaths age 15-24 year old age group versus the earlier age 5-14 year old age group.
Calculation for percent change is ((New Value - Old Value) / Old Value)*100 = ((Age 15-24 year old crude deaths - Age 5-14 year old crude deaths)/Age 5-14 year old crude deaths)*100 = (152,371 - 27,075/27,075 = 463% increases in crude deaths for persons aged 15-24 years old compared to earlier age group age 5-14 years old.
we see significant death increase, 72% death increase for persons aged 25-34 years old, compared to earlier age group age 15-24 years old, there were 109,617 more deaths in the age 25-34 year old age group versus the earlier age 15-24 years old age group.
Calculation for percent change is ((New Value - Old Value) / Old Value)*100 = ((Age 25-34 year old Crude deaths - Age 15-24 year old crude deaths)/Age 15-24 year old crude deaths)*100 = (261,988 - 152,371/152,371 = 72% increases in crude deaths for persons aged 25-34 years old compared to earlier age group age 15-24 years old
Key U.S. State Findings Ages 25-34 years old, comparing recent five year deaths 2013-2017 to prior five years 2008-2012, State alphabetical table

What three states have the highest age 25-34 year old crude death rates 2013-2017?
Answer: West Virginia, New Mexico and Alabama have the highest age 25-34 crude death rates in the recent five years, 2013-2017. States with the highest death rates need the most support.

During 2013-2017 the following 29 states had a age 25-34 year old death rate greater than U.S. age 25-34 year death rate '118.8', listed worst to best: West Virginia, New Mexico, Alabama, Kentucky, Mississippi, Louisiana, Alaska, Ohio, Arkansas, New Hampshire, Tennessee, Indiana, Oklahoma, South Carolina, Montana, Pennsylvania, Delaware, Wyoming, Missouri, Michigan, Maryland, Maine, Arizona, Florida, North Carolina, Georgia, North Dakota, Vermont, South Dakota, Nevada, Utah.
The table below indicates the 261,988 U.S. age 25-34 deaths in the recent five year period, 2013-2017, sorted by state age 25-34 year old crude death rate.
Orange indicates the top 15 worst Crude death rates per state population. The red bars to the right indicate crude death volume.
U.S. Crude DR for ages 25-34 during 2013-2017 recent five year span = (Crude Deaths/Population)*100,000 = 118.8 = ((261,988) / (220,518,208)) * 100,000 = 118.8
 the Red light indicates a state crude death rate is higher "worse" than the U.S. age 25-34 year old crude death rate '118.8'. States that are struggling with crude death have a higher death rate than the U.S. death rate.
Population rank is broken into three categories: 
Age Division % Change (Age Group Comparison
In U.S., in the recent five year span, 2013-2017, we see a significant increase in crude death for persons aged 15-24 years old, compared to earlier age group age 5-14 years old, we see a 463% increase in crude death for persons aged 15-24 years old, compared to earlier age group age 5-14 years old. There were 125,296 more crude deaths age 15-24 year old age group versus the earlier age 5-14 year old age group.
Calculation for percent change is ((New Value - Old Value) / Old Value)*100 = ((Age 15-24 year old crude deaths - Age 5-14 year old crude deaths)/Age 5-14 year old crude deaths)*100 = (152,371 - 27,075/27,075 = 463% increases in crude deaths for persons aged 15-24 years old compared to earlier age group age 5-14 years old.
-----------------------------------------------------------------------------------------------------------------
In the following age group, age 25-34 years old,
we see significant death increase, 72% death increase for persons aged 25-34 years old, compared to earlier age group age 15-24 years old, there were 109,617 more deaths in the age 25-34 year old age group versus the earlier age 15-24 years old age group.
we see significant death increase, 72% death increase for persons aged 25-34 years old, compared to earlier age group age 15-24 years old, there were 109,617 more deaths in the age 25-34 year old age group versus the earlier age 15-24 years old age group.
Calculation for percent change is ((New Value - Old Value) / Old Value)*100 = ((Age 25-34 year old Crude deaths - Age 15-24 year old crude deaths)/Age 15-24 year old crude deaths)*100 = (261,988 - 152,371/152,371 = 72% increases in crude deaths for persons aged 25-34 years old compared to earlier age group age 15-24 years old
Key U.S. State Findings Ages 25-34 years old, comparing recent five year deaths 2013-2017 to prior five years 2008-2012, State alphabetical table
What three states have the highest age 25-34 year old crude death rates 2013-2017?
Answer: West Virginia, New Mexico and Alabama have the highest age 25-34 crude death rates in the recent five years, 2013-2017. States with the highest death rates need the most support.
During 2013-2017 the following 29 states had a age 25-34 year old death rate greater than U.S. age 25-34 year death rate '118.8', listed worst to best: West Virginia, New Mexico, Alabama, Kentucky, Mississippi, Louisiana, Alaska, Ohio, Arkansas, New Hampshire, Tennessee, Indiana, Oklahoma, South Carolina, Montana, Pennsylvania, Delaware, Wyoming, Missouri, Michigan, Maryland, Maine, Arizona, Florida, North Carolina, Georgia, North Dakota, Vermont, South Dakota, Nevada, Utah.
The table below indicates the 261,988 U.S. age 25-34 deaths in the recent five year period, 2013-2017, sorted by state age 25-34 year old crude death rate.
Orange indicates the top 15 worst Crude death rates per state population. The red bars to the right indicate crude death volume.
DR (Death Rate) = (Crude Death Rate)/Population*100,000.
U.S. Crude DR for ages 25-34 during 2013-2017 recent five year span = (Crude Deaths/Population)*100,000 = 118.8 = ((261,988) / (220,518,208)) * 100,000 = 118.8
There were 118.8 deaths per 100,000 persons age 25-34 years old in the U.S. during 2013-2017.
Population rank is broken into three categories:
HV = high volume 1-15 = HV
MV = medium volume 16-31 = MV
LV = low volume = 32+ = LV
What are the top 15 states with the highest age 25-34 crude death rates in the last five year period, 2013-2017?
All young deaths are sad, it is really concerning and very sad is seeing a HV (high volume population) state Ohio #8 in the top 10 - takes ALOT of death to move a high population state up to a death rate that high, death rate is deaths/populations.
Answer: During 2013-2017 the following 15 states have the worst, highest crude death rates. States that are struggling have a crude death rate higher or 'worse than' the U.S. crude DR '118.8'.
Population Rank (1-15=HV, 16-31=MV, 32+= LV).
HV= High Volume,
MV= Medium Volume,
LV = Low Volume.
HV= High Volume,
MV= Medium Volume,
LV = Low Volume.
During 2013-2017 five year period, the following 15 states have the worst, ‘highest’ Age 25-34 crude death rates. States that are struggling have a crude death rate higher or 'worse than' the U.S. crude DR '118.8'.
- #1 West Virginia, DR 206.1, is 87 points above the U.S. age 25-34 year old death rate ‘118.8’, 2,250 25-34 yr old deaths
- #2 New Mexico DR 190.6, is 72 points above the U.S. age 25-34 year old death rate ‘118.8’, 2,668 25-34 yr old deaths
- #3 Alabama DR 173.1, is 54 points above the U.S. age 25-34 year old death rate ‘118.8’, 5,467 25-34 yr old deaths
- #4 Kentucky DR 172.9, is 54 points above the U.S. age 25-34 year old death rate ‘118.8’, 4,935 25-34 yr old deaths
- #5 Mississippi DR 172.2, is 53 points above the U.S. age 25-34 year old death rate ‘118.8’, 3,379 25-34 yr old deaths
- #6 Louisiana DR 169.5, is 51 points above the U.S. age 25-34 year old death rate ‘118.8’, 5,711 25-34 yr old deaths
- #7 Alaska DR 164.7, is 46 points above the U.S. age 25-34 year old death rate ‘118.8’, 979 25-34 yr old deaths
- #8 Ohio DR 159.2, is 40 points above the U.S. age 25-34 year old death rate ‘118.8’, 11,845 25-34 yr old deaths
- #9 Arkansas DR 154.8, is 36 points above the U.S. age 25-34 year old death rate ‘118.8’, 3,016 25-34 yr old deaths
- #10 New Hampshire DR 153.6, is 35 points above the U.S. age 25-34 year old death rate ‘118.8’, 1,207 25-34 yr old deaths
- #11 Tennessee DR 151.2, is 32 points above the U.S. age 25-34 year old death rate ‘118.8’, 6,632 25-34 yr old deaths
- #12 Indiana DR 150.8, is 32 points above the U.S. age 25-34 year old death rate ‘118.8’, 6,435 25-34 yr old deaths
- #13 Oklahoma DR 150.3, is 31 points above the U.S. age 25-34 year old death rate ‘118.8’, 4,045 25-34 yr old deaths
- #14 South Carolina DR 149.8, is 31 points above the U.S. age 25-34 year old death rate ‘118.8’, 4,801 25-34 yr old deaths
- #15 Montana DR 146.7, is 28 points above the U.S. age 25-34 year old death rate ‘118.8’, 962 25-34 yr old deaths
- #16 Pennsylvania DR 146.6, is 28 points above the U.S. age 25-34 year old death rate ‘118.8’, 12,142 25-34 yr old deaths States that have high death rates, need critical support to investigate counties where this is happening, to determine what is causing this high death increase to develop strategies to support good health and prevent early death. (County reports will be out ASAP)
Historical Crude Death Rates ages 25-34 years old: The table below compares the prior five year state crude death rates 2008-2012 to recent five year state crude death rates 2013-2017.

The chart below sorts U.S. age 25-34 Crude Deaths, 2013-2017, 5 year span, by state crude death volume.
63% of deaths occurred in 15 states.

What state had the highest age 25-34 crude death increase in the last five year span, 2013-2017, compared to the five years prior 2008-2012?
Answer: New Hampshire had a 84% crude death increase, the highest age 25-34 year old crude death increase in the recent five years, 2013-2017.
New Hampshire had a 84.% crude death increase for ages 25-34 years old, - - - - 551 more crude deaths in the recent five year span versus prior 5 years, 2013-2017 versus 2008-2012 = 1,207 - 656 = 551 more crude deaths in the last 5 year span. New Hampshire had 1,207 age 25-34 year old crude deaths in the last 5 years, 2013-2017.
New Hampshire age 25-34 year old crude death rate increased 63.5 points comparing recent 5 year crude death rate to prior 5, 2013-2017 vs 2008-2012 death rates = 153.6 - 90.1 = 63.5 death rate point increase in the recent five year period, 2013-2017. DR (Death Rate) = (Crude Death Rate)/Population*100,000.
Calculation for Percent Change = ((New Value - Old Value)/ Old Value )*100 = 84.% = New Hampshire ((2013-2017 Crude deaths - 2008-2012 Crude deaths ) / (2008-2012 Crude deaths ))*100 = ((1,207 - 656) / ( 656))*100 = ((551) / ( 656))*100 = 84.%

What are the top 15 states with the highest age 25-34 year old crude death increase in the last five year span, 2013-2017, compared to the five years prior 2008-2012?

The table below compares recent five year age 25-34 year old state crude deaths to the prior five years, 2013-2017, five year span compared to 5 years prior 2008-2012, sorted by age 25-34 year old state crude death percent change (crude death increase/decrease).
Calculation for Percent Change = ((New Value - Old Value)/ Old Value )*100 = ((2013-2017 crude deaths - 2008-2012 crude deaths ) / (2008-2012 crude deaths ))*100
Dark Red Highlight indicates state death increase in the table below. States that have high death increase, need critical support to investigate counties where this is happening, to understand what is causing this high death increase to develop strategies to support good health and prevent early death. (County reports will be out ASAP)

*******************************************************************
This report includes all deaths, Crude death is a measure of all death for a specified period and age group.
*******************************************************************
Source:
Copyright information
Resources –Seeking Help
National Suicide Prevention Lifeline http://www.suicidepreventionlifeline.org
If You Suspect your child is using drugs http://www.drugfree.org/intervene
Treatment Locator – National listing by SAMHSA and Referral Hotline (SAMHSA) 1-877-SAMHSA-7a
Veteran’s and their Families. http://www.veteranscrisisline.net/Resources/SpreadTheWord.aspx
24 Hour Toll Free Prayer Lines
Common Ground: (248) 456-8144
Responsibility:
When young deaths rise, a critical situation is occurring, as responsible citizens, we can find ways to support critical populations, support the young, elderly and the lowly. We can investigate what is happening, have any laws changed in an area that could affect the health of people.
Greatest Commandment: Matthew 22:35-40
Contact: Phone: Please join us in supporting good health of all people call 248-392-8676 or email hismatter@gmail.com or join us at
Mind-Altering-Substance Reports old: the link below works if you replace the ^^^" with a period dot "." Facebook blocked the reports again, some reports are still here until we move them to the site listed above, in the meantime replace ^^^ with a "." https://hisgracematters^^^blogspot.com/p/us-substance-deaths-2013-2017-5-year.html
Crude_Death_Reports_Old: the link below works if you replace the ^^^" with a period dot "." Facebook blocked the reports again, some reports are still here until we move them to the site listed above, in the meantime replace ^^^ with a "." https://HisGraceMattersCommunityNumbersMatter^^^blogspot.com/
*******************************************************************
This report includes all deaths, Crude death is a measure of all death for a specified period and age group.
This report includes all deaths, Crude death is a measure of all death for a specified period and age group.
*******************************************************************
Source:
Centers for Disease Control and Prevention, National Center for Health Statistics. Dataset: Underlying Cause of Death. 1999-2017 on CDC WONDER Online Database, released December, 2018. Data from the Multiple Cause of Death Files, 1999-2017, as compiled from data provided by the 57 vital statistics jurisdictions through the Vital Statistics Cooperative Program. CDC source data, but not a CDC publication. Data Accessed at http://wonder.cdc.gov/ and https://wonder.cdc.gov/ucd-icd10.html
Group By: State; Ten-Year Age Groups
Copyright information
Permission is given to print and share this report to support education and health of people, free of charge. When you share or print, suggested citation includes source, facebook page and blog.
Resources –Seeking Help
Medical Emergency Call 911
National Suicide Prevention Lifeline http://www.suicidepreventionlifeline.org
National Suicide Prevention Lifeline 1-800-273-TALK
National Suicide Prevention Lifeline 1-800-273-8255
National Suicide Prevention Lifeline for Deaf & hard of hearing 1-800-799-4889
If You Suspect your child is using drugs http://www.drugfree.org/intervene
Treatment Locator – National listing by SAMHSA and Referral Hotline (SAMHSA) 1-877-SAMHSA-7a
Veteran’s and their Families. http://www.veteranscrisisline.net/Resources/SpreadTheWord.aspx
Veteran’s and their Families Call: 1-800-273-8255
24 Hour Toll Free Prayer Lines
Daystar 1-800-329-0029
Catholic prayer hotline TBD
National Prayer Center Assemblies of God 1-800-477-2937
Christian Broadcasting Network (700 Club) 1-800-759-0700
Common Ground: (248) 456-8144
Responsibility:
Young people are a blessing and are made to live. Losing young people in the land in which we live is devastating, we must never forget those we lost and keep moving forward to prevent the next generation from stumbling into this situation.
When young deaths rise, a critical situation is occurring, as responsible citizens, we can find ways to support critical populations, support the young, elderly and the lowly. We can investigate what is happening, have any laws changed in an area that could affect the health of people.
Greatest Commandment: Matthew 22:35-40
35 Then one of them, which was a lawyer, asked him a question, tempting him, and saying, 36 Master, which is the great commandment in the law? 37 Jesus said unto him, Thou shalt love the Lord thy God with all thy heart, and with all thy soul, and with all thy mind. 38 This is the first and great commandment. 39 And the second is like unto it, Thou shalt love thy neighbor as thyself. 40 On these two commandments hang all the law and the prophets.
Contact: Phone: Please join us in supporting good health of all people call 248-392-8676 or email hismatter@gmail.com or join us at
Mind-Altering-Substance Reports old: the link below works if you replace the ^^^" with a period dot "." Facebook blocked the reports again, some reports are still here until we move them to the site listed above, in the meantime replace ^^^ with a "." https://hisgracematters^^^blogspot.com/p/us-substance-deaths-2013-2017-5-year.html
Crude_Death_Reports: https://HisKingdomNumbersMatter.blogspot.com
Crude_Death_Reports_Old: the link below works if you replace the ^^^" with a period dot "." Facebook blocked the reports again, some reports are still here until we move them to the site listed above, in the meantime replace ^^^ with a "." https://HisGraceMattersCommunityNumbersMatter^^^blogspot.com/