Total Pageviews

💔#Michigan God/Jesus is the way, not substances, 880,289 deaths, #6 worst state DR (death rate) increase, moved up⏫9 sickening notches to #14 WORST U.S. state DR recent 9 years 2012-2020, 78 counties 94% CRITICAL death⏫73 counties 88% DR (death rate) greater than U.S., a 7.4% critical county death rate increase as WEED alcohol opiates VAPE increase!

880,289 deaths, DR 984.1 is 119.3 points>U.S. DR, deaths⏫12.3% DR111.0 points!

Evidence based results indicate weed is deceiving, sad tragedy for Michigan, 81 counties (97.6%) critical DR (death rate) increase after weed, 96,333 more deaths, 25,324 young deaths ages 15-34 years old (previously strong kids) 9 years after WA/CO weed 2012-2020 as alcohol, weed, OPIATE, meth, vape, nicotine, kratom, benzos, CBD, ecig increased with tragic results!

Jesus recovery works, change adult use to 35 years old, prohibit advertising mind-altering substances, bring kids to Jesus, they will be blessed🎁its a promise Mark 10:13-16 Grandfather prior to prevent dissension, such as changing drinking age from 18 to 21 years old - SAVE THE KIDS!!  


29% death⏫ Livingston Leelanau Kalkaska😭
28% deathLapeer Clinton Emmet😭
26% death Ottawa😭
23% death ⏫GrandTraverse😭
21% death Mecosta Otsego Eaton 😭
20% death Allegan Monroe😭
18% death Shiawassee Benzie Macomb Lenawee 😭
17/16 % death Wexford Isabella Manistee Genesee 
Crawford  ages 15-34 years old 53 deaths,112% death⏫, DR 123.6 points> U.S. is #79 top-worst U.S. county DR needs support!  #9th top-worst county death increase in US!  
Manistee#1 worst ages 15-24 death in U.S., 172.7% death⏫66 notches, ages 15-34 years old 70 deaths

Oakland 73,641, Macomb 61,094 Kent 33,322, Washtenaw 15,893  Ingham 15,324

All Ages Michigan Recent 9 years 2012-2020 vs Prior 9 years 2003-2011

Sorted by Death Rate

1) worst Alcona County, MI 1,678 deaths, 1,785.3 DR (death rate) is critical 920.5 points greater than US DR, 10.2% death increase, DR increased 286.1 points, is 20th highest worst US DR, is 28th worst ages 15-34 years old MI DR 16 deaths!

2) Montmorency, MI 1,479 deaths 1,766.2 DR is critical 901.4 points > US DR, 8.5% death increase, DR increased 254.9 points, is 23th highest worst US DRis 5th worst ages 15-34 years old MI DR 21 deaths, 9 years prior No DEATHS ages 15-34 before weed, no warning!

3) Iron County, MI 1,784 deaths 1,759.3 DR is critical 894.4 points> US DR, deaths decreased -0.2%, DR increased 128.0 points, is 24th highest worst US DR, is 13th worst ages 15-34 years old MI DR 23 deaths4th highest worst ages 15-24 death rate in MI!

4Roscommon , MI 3,703 deaths 1,718.7 DR is critical 853.9 points>US DR, deaths increased 10.9%, DR increased 244.8 points #12th worst ages 15-34 years old DR 34 deaths9th highest worst ages 25-24 death rate in MI!

5) Ontonagon Cnty, MI 913 deaths 1,694.6 DR is critical 829.8 -9.2% death decrease, DR increased 122.0 points, ages 15-34 years old 13 deaths! 2nd highest worst ages 15-34 death rate in MI#220 top-worst county ages 15-34 US death rate!

6) Iosco County, MI 3,808 deaths 1,674.7 DR is critical 809.9 9.2% death increase, DR increased 211.20 points, ages 15-34 years old 71 deaths 65.1% death increase #47 worst ages 15-34 U.S. death rate increased 69.9 points#71 highest ages 15-34 yrs old U.S. death increase

7) Oscoda County, MI 1,185 deaths 1,579.4 DR is critical 714.6 9.7% death increase, DR increased 243.90 points, ages 15-34 years old 18 deaths,17th highest worst ages 15-34 death rate in MI!

8) Ogemaw County, MI 2,936 deaths 1,550.1 DR is critical 685.3 points>US DR, deaths increased 12.5%, DR increased 225.7 points

9) Presque Isle Cnty, MI 1,783 deaths 1,542.6 DR is critical 677.8 points>US DR, deaths increased 10.6%, DR increased 244.0 points

10) Huron County, MI 4,137 deaths 1,455.7DR is critical 590.9 points>US DR, deaths increased 4.3%, DR increased 158.9 points

11) Lake County, MI 1,504 deaths 1,439.5 DR is critical 574.7 points>US DR, deaths increased 13.7%, DR increased 177.8 points

12) Gladwin County, MI 3,279 deaths 1,437.4 DR is critical 572.6 points>US DR, deaths increased 14.2%, DR increased 224.8 points

13) Clare County, MI 3,963 deaths 1,435.8 DR is critical 571.0 points>US DR, deaths increased 13.9%, DR increased 202.8 points

14) Schoolcraft County, MI 1,025 deaths 1,399.3 DR is critical 534.5 points>US DR, deaths increased 1.7%, DR increased 113.9 points

15) Arenac County, MI 1,892 deaths 1,384.8 DR is critical 520.0 points>US DR, deaths increased 5.7%, DR increased 187.7 points

16) Gogebic County, MI 1,891 deaths 1,383.7 DR is critical DR is critical 518.8 points>US DR, deaths decreased -12.4%, DR decreased -58.2 points

17) Mackinac County, MI 1,328 deaths 1,353.9 DR is critical 489.1 points>US DR, deaths increased 10.3%, DR increased 177.9 points

18) Manistee County, MI 2,960 deaths 1,341.6 DR is critical 476.8 points>US DR, deaths increased 16.4%, DR increased 210.6 points

19) Alpena County, MI 3,413 deaths 1,321.4 DR is critical 456.6 points>US DR, deaths increased 9.4%, DR increased 171.0 points

20) Cheboygan County, MI 2,969 deaths 1,293.8 DR is critical 428.9 points>US DR, deaths increased 13.0%, DR increased 204.3 points

21) Crawford County, MI1,611 deaths 1,288.6 DR is critical 423.8 points>US DR, deaths increased 14.5%, DR increased 202.5 points

22) Baraga County, MI 973 deaths 1,276.2 DR is critical 411.3 points>US DR, deaths increased 6.0%, DR increased 126.4 points

23) Delta County, MI 4,139 deaths 1,269.1 DR is critical 404.2 points>US DR, deaths increased 11.5%, DR increased 172.1 points

24) Dickinson Cnty, MI 2,890 deaths 1,252.5 DR is critical 387.6 points>US DR, deaths increased 4.0%, DR increased 96.5 points

25) Menominee Cnty, MI 2,587 deaths 1,234.5 369.6 points>US DR, deaths increased 13.1%, DR increased 194.4 points

26) Ogemaw County, MI 1,024 deaths 1,226.9 DR is critical 362.0 points>US DR, deaths increased 0.0%, DR increased 44.0 points

27) Benzie County, MI 1,929 deaths 1,217.9 DR is critical 353.1 points>US DR, deaths increased 18.2%, DR increased 187.3 points

28) Bay County, MI 11,445 deaths 1,212.4 DR is critical 347.5 points>US DR, deaths increased 12.9%, DR increased 174.1 points

29) Sanilac County, MI 4,513 deaths 1,210.1 DR is critical 345.3 points>US DR, deaths increased 9.0%, DR increased 168.2 points

30) Mason County, MI 3,129 deaths 1,202.3 DR is critical 337.5 points>US DR, deaths increased 10.3%, DR increased 105.1 points

31) Antrim County, MI 2,459 deaths 1,172.2 DR is critical 307.4 points>US DR, deaths increased 13.6%, DR increased 170.0 points

32) Kalkaska County, MI 1,843 deaths 1,168.6 DR is critical 303.8 points>US DR, deaths increased 29.0%, DR increased 254.2 points

33) Calhoun County, MI 14,065 deaths 1,162.4 DR is critical 297.5 1 points>US DR, deaths increased 0.7%, DR increased 136.7 points

34) Tuscola County, MI 5,575 deaths 1,161.8DR is critical critical 297.0 points>US DR, deaths increased 13.9%, DR increased 207.4 points

35) Berrien County, MI 15,948 deaths 1,147.3 DR is critical 282.5 points>US DR, deaths increased 9.7%, DR increased 125.1 points

36) Leelanau County, MI 2,234 deaths 1,140.1 DR is critical 275.3 points>US DR, deaths increased 29.2%, DR increased 256.7 points

37) Luce County, MI 652 deaths 1,139.5 DR is critical 274.7 points>US DR, deaths increased 0.5%, DR increased 69.5 points

38) Gratiot County, MI 4,220 deaths 1,137.3 DR is critical 272.5 points>US DR, deaths increased 8.1%, DR increased 117.5 points

39) Genesee County, MI 41,884 deaths 1,134.8 DR is critical 269.9 points>US DR, deaths increased 16.3%, DR increased 214.5 points

40) Keweenaw County, MI 220 deaths 1,131.5 DR is critical 266.7 points>US DR, deaths increased 2.3%, DR increased 8.0 points

41) St. Clair County, MI 16,212 deaths 1,127.6 DR is critical 262.8 points>US DR, deaths increased 17.5%, DR increased 204.7 points

42) Saginaw County, MI 19,586 deaths 1,126.5 DR is critical 261.7 points>US DR, deaths increased 6.2%, DR increased 121.5 points

43) Missaukee Cnty, MI 1,519 deaths 1,121.0 DR is critical 256.2 points>US DR, deaths increased 18.0%, DR increased 167.6 points

44) Emmet County, MI 3,347 deaths 1,119.9 DR is critical 255.1 points>US DR, deaths increased 27.8%, DR increased 232.0 points

45) Otsego County, MI 2,450 deaths 1,115.3 DR is critical 250.5 points>US DR, deaths increased 21.3%, DR increased 197.7 points

46) St. Joseph Cnty, MI 6,040 deaths 1,101.4 DR is critical 236.6 points>US DR, deaths increased 13.4%, DR increased 146.1 points

47) Hillsdale County, MI 4,540 deaths 1,099.9 DR is critical 235.1 points>US DR, deaths increased 17.8%, DR increased 190.6 points

48) Shiawassee County, MI 6,768 deaths 1,097.4 DR is critical 232.6 points>US DR, deaths increased 18.3%, DR increased 212.1 points

49) Wexford County, MI 3,254 deaths 1,090.4 DR is critical 225.6 points>US DR, deaths increased 17.3%, DR increased 138.8 points

50) Jackson County, MI 15,583 deaths 1,088.8 DR is critical 223.9 points>US DR, deaths increased 13.3% , DR increased 143.3 points

51) Charlevoix County, MI 2,558 deaths 1,087.0 DR is critical 222.2 points>US DR, deaths increased 11.5%, DR increased 119.0 points

52) Branch County, MI 4,236 deaths 1,080.3 DR is critical 215.4 points>US DR, deaths increased 9.4%, DR increased 149.1 points

53) Lenawee County, MI 9,541 deaths 1,075.1 DR is critical 210.3 points>US DR, deaths increased 18.1%, DR increased 184.9 points

54) Wayne County, MI 168,585 deaths 1,064.4 DR is critical 199.6 points>US DR, deaths increased 1.2%, DR increased 90.9 points

55) Osceola County, MI 2,228 deaths 1,064.0 DR is critical 199.2 points>US DR, deaths increased 11.7%, DR increased 131.2 points

56) Cass County, MI 4,904 deaths 1,053.7 DR is critical 188.9 points>US DR, deaths increased 12.4%, DR increased 126.9 points

57) Newaygo County, MI 4,563 deaths 1,048.5 DR is critical 183.6 points>US DR, deaths increased 13.9%, DR increased 139.9 points

58) Oceana County, MI 2,473 deaths 1,042.3 DR is critical 177.5 points>US DR, deaths increased 12.3%, DR increased 140.3 points

59) Muskegon County, MI 15,999 deaths 1,029.2 DR is critical 164.4 points>US DR, deaths increased 10.8%, DR increased 101.7 points

60) Macomb County, MI 79,985 deaths 1,027.3 DR is critical 162.5 points>US DR, deaths increased 18.1%, DR increased 124.3 points

61) Van Buren County, MI 6,932 deaths 1,021.9 DR is critical 157.1 points>US DR, deaths increased 9.4%, DR increased 103.9 points

62) Marquette County, MI 6,131 deaths 1,017.6 DR is critical 152.8 points>US DR, deaths increased 10.5%, DR increased 87.9 points

63) Monroe County, MI 13,697 deaths 1,013.7 DR is critical 148.9 points>US DR, deaths increased 20.1%, DR increased 180.8 points

64) Houghton County, MI 3,279 deaths 1,007.3 DR is critical 142.5 points>US DR, deaths decreased -1.7%, DR decreased -16.7 points

65) Montcalm County, MI 5,720 deaths 1,003.7 DR is critical 138.9 points>US DR, deaths increased 14.3%, DR increased 127.5 points

66) Lapeer County, MI 7,902 deaths 996.6 DR is critical 131.8 points>US DR, deaths increased 28.7%, DR increased 240.0 points

67) Grand Traverse County, MI 7,948 deaths 963.8 DR is critical 99.0 points>US DR, deaths increased 22.5%, DR increased 117.7 points

68) Eaton County, MI 9,403 deaths 957.4 DR is critical 92.6 points>US DR, deaths increased 21.0%, DR increased 156.9 points

69) Chippewa County, MI 3,261 deaths 955.7 DR is critical 90.9 points>US DR, deaths increased 13.1%, DR increased 133.6 points

70) Mecosta County, MI 3,689 deaths 945.4 DR is critical 80.6 points>US DR, deaths increased 21.6%, DR increased 156.2 points

71) Barry County, MI 5,026 deaths 927.8 DR is critical 62.9 points>US DR, deaths increased 15.1%, DR increased 110.0 points

72) Midland County, MI 6,867 deaths 913.8 DR is critical 49.0 points>US DR, deaths increased 14.5%, DR increased 118.7 points

73) Allegan County, MI 9,233 deaths 888.3 DR is critical 23.5 points>US DR, deaths increased 20.3%, DR increased 119.6 points

74) Oakland County, MI 96,626 deaths 862.9 DR is -1.9 points<US DR, deaths increased 16.0%, DR increased 93.3 points

75) Ionia County, MI 4,824 deaths 833.9 DR is -31.0 points>US DR, deaths increased 15.9%, DR increased 116.4 points

76) Kalamazoo County, MI 19,472 deaths 828.3 DR is -36.6 points>US DR, deaths increased 11.5%, DR increased 40.8 points

77) Clinton County, MI 5,592 deaths 796.1 DR is -68.7 points>US DR, deaths increased 28.3%, DR increased 133.6 points

78) Livingston County, MI 13,237 deaths 781.4 DR is -83.4 points>US DR, deaths increased 29.5%, DR increased 147.9 points

79) Ingham County, MI 19,951 deaths 770.7 DR is -94.1 points>US DR, deaths increased 14.4%, DR increased 83.6 points

80) Kent County, MI 43,286 deaths 751.2 DR is -113.6 points>US DR, deaths increased 15.4%, DR increased 53.2 points

81) Isabella County, MI 4,465 deaths 703.5 DR is -161.3 points>US DR, deaths increased 16.8%, DR increased 85.8 points

82) Ottawa County, MI 17,798 deaths 699.7 DR is -165.1 points>US DR, deaths increased 25.7%, DR increased 92.5 points

83) Washtenaw County, MI 20,609 deaths 632.5 DR is -232.3 points>US DR, deaths increased 18.4%, DR increased 68.1 points

All Ages Michigan Recent 9 years 2012-2020 vs Prior 9 years 2003-2011

Sorted Alphabetical

Alcona County, MI 1,678 deaths 1,785.3 DR is critical 920.5 points>US DR, deaths increased 10.2%, DR increased 286.1 points

Alger County, MI 1,024 deaths 1,226.9 DR is critical 362.0 points>US DR, deaths increased 0.0%, DR increased 44.0 points

Allegan County, MI 9,233 deaths 888.3 DR is critical 23.5 points>US DR, deaths increased 20.3%, DR increased 119.6 points

Alpena County, MI 3,413 deaths 1,321.4 DR is critical 456.6 points>US DR, deaths increased 9.4%, DR increased 171.0 points

Antrim County, MI 2,459 deaths 1,172.2 DR is critical 307.4 points>US DR, deaths increased 13.6%, DR increased 170.0 points

Arenac County, MI 1,892 deaths 1,384.8 DR is critical 520.0 points>US DR, deaths increased 5.7%, DR increased 187.7 points

Baraga County, MI 973 deaths 1,276.2 DR is critical 411.3 points>US DR, deaths increased 6.0%, DR increased 126.4 points

Barry County, MI 5,026 deaths 927.8 DR is critical 62.9 points>US DR, deaths increased 15.1%, DR increased 110.0 points

Bay County, MI 11,445 deaths 1,212.4 DR is critical 347.5 points>US DR, deaths increased 12.9%, DR increased 174.1 points

Benzie County, MI 1,929 deaths 1,217.9 DR is critical 353.1 points>US DR, deaths increased 18.2%, DR increased 187.3 points

Berrien County, MI 15,948 deaths 1,147.3 DR is critical 282.5 points>US DR, deaths increased 9.7%, DR increased 125.1 points

Branch County, MI 4,236 deaths 1,080.3 DR is critical 215.4 points>US DR, deaths increased 9.4%, DR increased 149.1 points

Calhoun County, MI 14,065 deaths 1,162.4 DR is critical 297.5 points>US DR, deaths increased 10.7%, DR increased 136.7 points

Cass County, MI 4,904 deaths 1,053.7 DR is critical 188.9 points>US DR, deaths increased 12.4%, DR increased 126.9 points

Charlevoix County, MI 2,558 deaths 1,087.0 DR is critical 222.2 points>US DR, deaths increased 11.5%, DR increased 119.0 points

Cheboygan County, MI 2,969 deaths 1,293.8 DR is critical 428.9 points>US DR, deaths increased 13.0%, DR increased 204.3 points

Chippewa County, MI 3,261 deaths 955.7 DR is critical 90.9 points>US DR, deaths increased 13.1%, DR increased 133.6 points

Clare County, MI 3,963 deaths 1,435.8 DR is critical 571.0 points>US DR, deaths increased 13.9%, DR increased 202.8 points

Clinton County, MI 5,592 deaths 796.1 DR is -68.7 points<US DR, deaths increased 28.3%, DR increased 133.6 points

Crawford County, MI 1,611 deaths 1,288.6 DR is critical 423.8 points>US DR, deaths increased 14.5%, DR increased 202.5 points

Delta County, MI 4,139 deaths 1,269.1 DR is critical 404.2 points>US DR, deaths increased 11.5%, DR increased 172.1 points

Dickinson County, MI 2,890 deaths 1,252.5 DR is critical 387.6 points>US DR, deaths increased 4.0%, DR increased 96.5 points

Eaton County, MI 9,403 deaths 957.4 DR is critical 92.6 points>US DR, deaths increased 21.0%, DR increased 156.9 points

Emmet County, MI 3,347 deaths 1,119.9 DR is critical 255.1 points>US DR, deaths increased 27.8%, DR increased 232.0 points

Genesee County, MI 41,884 deaths 1,134.8 DR is critical 269.9 points>US DR, deaths increased 16.3%, DR increased 214.5 points

Gladwin County, MI 3,279 deaths 1,437.4 DR is critical 572.6 points>US DR, deaths increased 14.2%, DR increased 224.8 points

Gogebic County, MI 1,891 deaths 1,383.7 DR is critical 518.8 points>US DR, deaths decreased -12.4%, DR decreased -58.2 points

Grand Traverse County, MI 7,948 deaths 963.8 DR is critical 99.0 points>US DR, deaths increased 22.5%, DR increased 117.7 points

Gratiot County, MI 4,220 deaths 1,137.3 DR is critical 272.5 points>US DR, deaths increased 8.1%, DR increased 117.5 points

Hillsdale County, MI 4,540 deaths 1,099.9 DR is critical 235.1 points>US DR, deaths increased 17.8%, DR increased 190.6 points

Houghton County, MI 3,279 deaths 1,007.3 DR is critical 142.5 points>US DR, deaths decreased -1.7%, DR decreased -16.7 points

Huron County, MI 4,137 deaths 1,455.7 DR is critical 590.9 points>US DR, deaths increased 4.3%, DR increased 158.9 points

Ingham County, MI 19,951 deaths 770.7 DR is -94.1 points<US DR, deaths increased 14.4%, DR increased 83.6 points

Ionia County, MI 4,824 deaths 833.9 DR is -31.0 points<US DR, deaths increased 15.9%, DR increased 116.4 points

Iosco County, MI 3,808 deaths 1,674.7 DR is critical 809.9 points>US DR, deaths increased 9.2%, DR increased 211.2 points

Iron County, MI 1,784 deaths 1,759.3 DR is critical 894.4 points>US DR, deaths decreased -0.2%, DR decreased 128.0 points

Isabella County, MI 4,465 deaths 703.5 DR is -161.3 points<US DR, deaths increased 16.8%, DR increased 85.8 points

Jackson County, MI 15,583 deaths 1,088.8 DR is critical 223.9 points>US DR, deaths increased 13.3%, DR increased 143.3 points

Kalamazoo County, MI 19,472 deaths 828.3 DR is -36.6 points<US DR, deaths increased 11.5%, DR increased 40.8 points

Kalkaska County, MI 1,843 deaths 1,168.6 DR is critical 303.8 points>US DR, deaths increased 29.0%, DR increased 254.2 points

Kent County, MI 43,286 deaths 751.2 DR is -113.6 points<US DR, deaths increased 15.4%, DR increased 53.2 points

Keweenaw County, MI 220 deaths 1,131.5 DR is critical 266.7 points>US DR, deaths increased 2.3%, DR increased 8.0 points

Lake County, MI 1,504 deaths 1,439.5 DR is critical 574.7 points>US DR, deaths increased 13.7%, DR increased 177.8 points

Lapeer County, MI 7,902 deaths 996.6 DR is critical 131.8 points>US DR, deaths increased 28.7%, DR increased 240.0 points

Leelanau County, MI 2,234 deaths 1,140.1 DR is critical 275.3 points>US DR, deaths increased 29.2%, DR increased 256.7 points

Lenawee County, MI 9,541 deaths 1,075.1 DR is critical 210.3 points>US DR, deaths increased 18.1%, DR increased 184.9 points

Livingston County, MI 13,237 deaths 781.4 DR is -83.4 points<US DR, deaths increased 29.5% DR increased 147.9 points

Luce County, MI 652 deaths 1,139.5 DR is critical 274.7 points>US DR, deaths increased 0.5%, DR increased 69.5 points

Mackinac County, MI 1,328 deaths 1,353.9 DR is critical 489.1 points>US DR, deaths increased 10.3%, DR increased 177.9 points

Macomb County, MI 79,985 deaths 1,027.3 DR is critical 162.5 points>US DR, deaths increased 18.1%, DR increased 124.3 points

Manistee County, MI 2,960 deaths 1,341.6 DR is critical 476.8 points>US DR, deaths increased 16.4%, DR increased 210.6 points

Marquette County, MI 6,131 deaths 1,017.6 DR is critical 152.8 points>US DR, deaths increased 10.5%, DR increased 87.9 points

Mason County, MI 3,129 deaths 1,202.3 DR is critical 337.5 points>US DR, deaths increased 10.3%, DR increased 105.1 points

Mecosta County, MI 3,689 deaths 945.4 DR is critical 80.6 points>US DR, deaths increased 21.6%, DR increased 156.2 points

Menominee County, MI 2,587 deaths 1,234.5 DR is critical 369.6 points>US DR, deaths increased 13.1%, DR increased 194.4 points

Midland County, MI 6,867 deaths 913.8 DR is critical 49.0 points>US DR, deaths increased 14.5%, DR increased 118.7 points

Missaukee County, MI 1,519 deaths 1,121.0 DR is critical 256.2 points>US DR, deaths increased 18.0%, DR increased 167.6 points

Monroe County, MI 13,697 deaths 1,013.7 DR is critical 148.9 points>US DR, deaths increased 20.1%, DR increased 180.8 points

Montcalm County, MI 5,720 deaths 1,003.7 DR is critical 138.9 points>US DR, deaths increased 14.3%, DR increased 127.5 points

Montmorency County, MI 1,479 deaths 1,766.2 DR is critical 901.4 points>US DR, deaths increased 8.5%, DR increased 254.9 points

Muskegon County, MI 15,999 deaths 1,029.2 DR is critical 164.4 points>US DR, deaths increased 10.8%, DR increased 101.7 points

Newaygo County, MI 4,563 deaths 1,048.5 DR is critical 183.6 points>US DR, deaths increased 13.9%, DR increased 139.9 points

Oakland County, MI 96,626 deaths 862.9 DR is -1.9 points<US DR, deaths increased 16.0%, DR increased 93.3 points

Oceana County, MI 2,473 deaths 1,042.3 DR is critical 177.5 points>US DR, deaths increased 12.3%, DR increased 140.3 points

Ogemaw County, MI 2,936 deaths 1,550.1 DR is critical 685.3 points>US DR, deaths increased 12.5%, DR increased 225.7 points

Ontonagon County, MI 913 deaths 1,694.6 DR is critical 829.8 points>US DR, deaths decreased -9.2%, DR increased 122.0 points

Osceola County, MI 2,228 deaths 1,064.0 DR is critical 199.2 points>US DR, deaths increased 11.7%, DR increased 131.2 points

Oscoda County, MI 1,185 deaths 1,579.4 DR is critical 714.6 points>US DR, deaths increased 9.7%, DR increased 243.9 points

Otsego County, MI 2,450 deaths 1,115.3 DR is critical 250.5 points>US DR, deaths increased 21.3%, DR increased 197.7 points

Ottawa County, MI 17,798 deaths 699.7 DR is -165.1 points<US DR, deaths increased 25.7%, DR increased 92.5 points

Presque Isle County, MI 1,783 deaths 1,542.6 DR is critical 677.8 points>US DR, deaths increased 10.6%, DR increased 244.0 points

Roscommon County, MI 3,703 deaths 1,718.7 DR is critical 853.9 points>US DR, deaths increased 10.9%, DR increased 244.8 points

Saginaw County, MI 19,586 deaths 1,126.5 DR is critical 261.7 points>US DR, deaths increased 6.2%, DR increased 121.5 points

Sanilac County, MI 4,513 deaths 1,210.1 DR is critical 345.3 points>US DR, deaths increased 9.0%, DR increased 168.2 points

Schoolcraft County, MI 1,025 deaths 1,399.3 DR is critical 534.5 points>US DR, deaths increased 1.7%, DR increased 113.9 points

Shiawassee County, MI 6,768 deaths 1,097.4 DR is critical 232.6 points>US DR, deaths increased 18.3%, DR increased 212.1 points

St. Clair County, MI 16,212 deaths 1,127.6 DR is critical 262.8 points>US DR, deaths increased 17.5%, DR increased 204.7 points

St. Joseph County, MI 6,04 deaths 0 deaths 1,101.4 DR is critical 236.6 points>US DR, deaths increased 13.4%, DR increased 146.1 points

Tuscola County, MI 5,575 1,161.8 DR is critical 297.0 points>US DR, deaths increased 13.9%, DR increased 207.4 points

Van Buren County, MI 6,932 deaths 1,021.9 DR is critical 157.1 points>US DR, deaths increased 9.4%, DR increased 103.9 points

Washtenaw County, MI 20,609 deaths 632.5 DR is -232.3 points<US DR, deaths increased 18.4%, DR increased 68.1 points

Wayne County, MI 168,585 deaths 1,064.4 DR is critical 199.6 points>US DR, deaths increased 1.2%, DR increased 90.9 points

Wexford County, MI 3,254 deaths 1,090.4 DR is critical 225.6 points>US DR, deaths increased 17.3%, DR increased 138.8 points

Michigan Deaths by Age Groups - - - - - - - - - - - - - - - - - - - - -  - - - - - - - - - - - - - - - - - - - - -

 All agesinfants under 1 yrs oldages 1-4,ag es 5-14,ages 15-34 years old,ages 15-24ages 25-34ages 35-44ages 45-54ages 55-64ages 65-74,  ages 75-84, ages 85+, Substance Deaths Michigan 

If Michigan doesn't turn to God repent of sin (we all sin), support laws that protect life, instead of $$., soon all counties will be in the RED, only 10 counties left with death rates below U.S. death rate! change adult use to 35 years old to get weed out of young crowd! Weed accident - proponents thought if weed was available, their loved one would have used that instead of opiate/alcohol preventing early death; instead crack-weed is addictive, leading kids to alcohol, violence and opiates. We were made to serve a loving God, we were not made to serve mind-altering substances. We have a great, awesome savior who lives with God in Heaven, our mediator/Jesus and God are mighty to save John 3:16, come back to church!

Michigan moved up 9 sickening notches from #23 to #14 top-WORST death rate state in U.S. recent 9 years 2012-2020 after WA/CO weed, Horrific 12.3% state death🠉tragic young deaths 25,324 deaths ages 15-34 years old, 88% of Michigan counties have WORSE death rate than U.S. DR 864.8! Michigan death rate 984.1 is 119.3 points higher, worse than U.S. DR (death rate) Michigan had HORRIFIC 111.0 point death rate🠉after weed, MI #6 worst state DR death rate 🠉!

Praying in Jesus name that Michigan stops 17% young death🠉by changing adult use from 21 to 35 years old before Michigan hits Colorado's 32% death⬆️ages 15-34 years old, grand father in prior such as changing drinking age from 18 to 21 years old. Perfect healing w Jesus & God 👑Jesus is the way to life - save kids✝️JOHN 3:16 - Michigan tragic 25,324 YOUNG deaths ages 15-34 years old recent 9 years 2012-2020⬆️3,683 more deaths⬆️limits Get weed away from kids as illicit deadly substances⬆️ see MI young death report

Praying Michigan stops ages 25-34 year old 32% young death⬆️by teaching Jesus & change adult use to 35 years old before MI hits Colorado's 50.5% death⬆️ages 25-34 years old, grandfather in prior such as changing drinking age from 18 to 21 years old, prayer in Jesus blessed and holy name bring kids to know Jesus prince of peace have sins forgiven, live in grace - put a lid on weed as illicit substances/alcohol⬆️is hurting kids - Oakland county 2,407 deaths ages 15-34 yrs old, 19% death ⬆️recent 9 years 2012-2020, change adult use to 35 years old stop advertising substances!

Michigan SAVE Crawford county KIDS w Jesus, ages 25-34 yrs old CRITICAL 245% young death⬆️50 notches from #52 to #2 worst DR - 38 young deaths recent 9 years, change adult use to 35 yrs old, grandfather prior as Illicicit substncs⬆️https://twitter.com/Revealingthetr2/status/1616236965254533120

Michigan SAVE Ontonagon county KIDS with Jesus, ages 25-34 yrs old #1 worst CRITICAL death rate 230 points higher than U.S. ages 25-34 year old DR, is the 37th death rate in nation recent 9 years 2012-2020 after rec WA/CO weed⬆️https://hiskingdomnumbersmatter.blogspot.com/p/michigan-young-adults-ages-25-34-years.htm

Michigan Raise the Bar Build Kingdom of God with Jesus and God our Father forgiveness God's great gift, we are saved through his grace - the way - 👑💓Isaiah 54:13 All your children shall be taught by the Lord, and great shall be the peace of your children.


U.S. KIDS need Jesus EMERGENCY protection to ages 34 years old  (All Ages by state Summary),Infants under 1 years old, ages 1-4ages 5-14, ages 15-34 years oldages 15-24ages 25-34,ages 35-44ages 45-54ages 55-64ages 65-74,  ages 75-84ages 85+ Top 75 worstTop worst ages 15-34Top worst ages 85+Top Horrific death rate increase of 2400+ points ages 85+ ages 15-34:  ColoradoOhioVermontNY,  see U.S. substance deaths by age group to view ages affected by mind-altering substances,

(Alabama 15-34 S)(Alaska 15-34 S), (Arizona 15-34 S), (Arkansas 15-34 S), (California 15-34 S), (Colorado 15-34 S), (Connecticut 15-34 S), (Delaware 15-34 S), (District of Columbia 15-34 S),  (Florida 15-34 S), (Georgia 15-34 S), (Hawaii 15-34 S), (Idaho 15-34 S), (Illinois 15-34 S), (Indiana 15-34 S), (Iowa 15-34 S), (Kansas 15-34 S),  (Kentucky 15-34 S), (Louisiana 15-34 S), (Maine 15-34 S),  (Maryland 15-34 S), (Massachusetts 15-34 S), (Michigan map 15 15-34 S), (Minnesota 15-34 S),  (Mississippi 15-34 S), (Missouri 15-34 S), (Montana 15-34 S), (Nebraska 15-34 S), (Nevada 15-34 S),  (New Hampshire 15-34 S), (New Jersey 15-34 S), (New Mexico 15-34 S), (New York 15-34 S), (North Carolina 15-34 S), (North Dakota 15-34 S), (Ohio 15-34 S), (Oklahoma 15-34 S), (Oregon 15-34 S),  (Pennsylvania 15-34 S), (Rhode Island 15-34 S), (South Carolina 15-34 S), (South Dakota 15-34 S),  (Tennessee 15-34 S), (Texas 15-34 S), (Utah 15-34 S), (Vermont 15-34 S), (Virginia 15-34 S),  (Washington 15-34 S), (West Virginia 15-34 S), (Wisconsin 15-34 S), (Wyoming 15-34 S) Colorado legalized rec weed 2012 warns consequences sick young devastation https://learnaboutsam.org/wp-content/uploads/2020/03/Colorado-One-Pager-39pdf.pdf?  

Michigan kids need Jesus EMERGENCY protection to ages  35, ages 25-34% ## DLA)  (ages 15-24 DLA  %  ## DR)   (ages 15-34 % ## DR 21 year Mystery DLA DR) (All Ages DR  DR & young %) increaseAll agesinfants under 1 yrs old, ages 1-4,  ages 5-14,  ages 15-34 years old,  ages 15-24ages 25-34ages 35-44ages 45-54ages 55-64ages 65-74,  ages 75-84, ages 85+, Substance Deaths Michigan All agesinfants under 1 yrs old, ages 1-4,  ages 5-14,  ages 15-34 years old,  ages 15-24ages 25-34ages 35-44ages 45-54ages 55-64ages 65-74,  ages 75-84, ages 85+, Substance_Deaths_Michigan  AlconaAlger,  Allegan,  Alpena,  Antrim,  Arenac,  Baraga,  Barry,  Bay,  Benzie,  Berrien,  Branch,  Calhoun,  Cass,  Charlevoix,  Cheboygan,  Chippewa,  Clare,  Clinton,  Crawford,  Delta,  Dickinson,  Eaton,  Emmet,  Genesee,  Gladwin,  Gogebic,  Grand_TraverseGratiot,  Hillsdale,  Houghton,  Huron,  Ingham,  Ionia,  Iosco,  Iron,  Isabella,  Jackson,  Kalamazoo,  Kalkaska,  Kent,  Keweenaw,  Lake,  Lapeer,  Leelanau,  Lenawee,  Livingston,  Luce,  Mackinac,  Macomb,  Manistee,  Marquette,  Mason,  Mecosta,  Menominee,  Midland,  Missaukee,  Monroe,  Montcalm,  Montmorency,  Muskegon,  Newaygo,  Oakland,  Oceana,  Ogemaw,  Ontonagon,  Osceola,  Oscoda,  Otsego,  Ottawa,  Presque_Isle,  RoscommonSaginawSanilacSchoolcraftShiawasseeSt. ClairSt. JosephTuscolaVan BurenWashtenawWayneWexford  SAD_recreational_facilities, Mich 6 counties Top 75 national worst!  wikipedia List_of_counties_in_Michigan  


Michigan recent 7 years 2013-2019- - - historical report before 2020 data was available - - - - -


Michigan moved up 5 sickening notches from #18 to #13 top-WORST death rate state in U.S. recent 7 years (2013-2019 versus 2006-2012). Horrific young deaths, MI county death rates so bad, 88% of Michigan counties have a higher WORSE death rate than U.S. DR 848.8!. Michigan death rate 967.3 is 118.6 points higher, worse than U.S. DR (death rate) 848.8 recent 7 years 2013-2019! 

Michigan, like other states bordering the St. Lawrence seaway, had CRITICAL death rate increase as illicit substances increase through port cities same time marijuana, vape, alcohol, tobacco, kratom, acid and Xanax increase, this is increasing young deaths which increases overall state deaths! 

Michigan had HORRIFIC 82.7 point death rate increase recent 7 years! If Michigan doesn't change, all counties will be in the RED, only 10 green Michigan counties left with green death rates, below U.S. death rate 848.8! Weed accident - proponents thought if weed was available, their loved one would have used that instead of opiate/alcohol preventing early death  - instead weed leads kids to opiates, see Colorado!  Praying Michigan repents, chooses to support life of kids/young adults, believes (like Nineveh) great lakes majestic hand God laid out for its people, repentant, clean, holy saved in Jesus name. 

CRITICAL! Recent 7 years 2013-2019, Michigan moved from a critical death rate 78.7 points greater WORSE than U.S. DR 806 to a HORRIFIC death rate  118.6 points greater WORSE than U.S. DR 848.8!  Prior 7 years, 8-14 years ago 2006-2012 Michigan had a death rate  78.7 points greater than worse than U.S. death rate 806.  Recent 7 years 2013-2019, U.S. death rate tragically increased 42.8 points from 806 to a DR 848.8.  Recent 7 years, Michigan death rate horrifically increased 82.7 points from DR 884.6 to DR 967.3!  Michigan had significant 9.5% death increase 2013-2019 vs 2006-2012 - - -  58,189 more deaths recent 7 Years.  Michigan had 673,282 deaths recent 7 years, 2013-2019.   

If Michigan doesn't change, soon all counties will be in the RED, no green low death rate counties. Only 10 green Michigan counties left with death rates, under U.S. death rate 848.8 (many of these counties had significant young death increase in recent seven years, are moving in the worst destruction direction)!!!

Every age group in Michigan is critical, see table below.  Age groups operated at a worse death rate than nation INDICATES GREAT SUFFERING, red light indicates critical MI age group death rate points above U.S. death rate!  The number of deaths and critical counties that need sober protection support are indicated for each age group for churches to prioritize support. Counties with horrific DR (death rate) increase of 100+ points needs the most support, see county list below.
  • Prior 7 years 8-14 years ago 2006-201271 Michigan counties had critical DRs (death rates) greater WORSE than U.S.  DR 806.
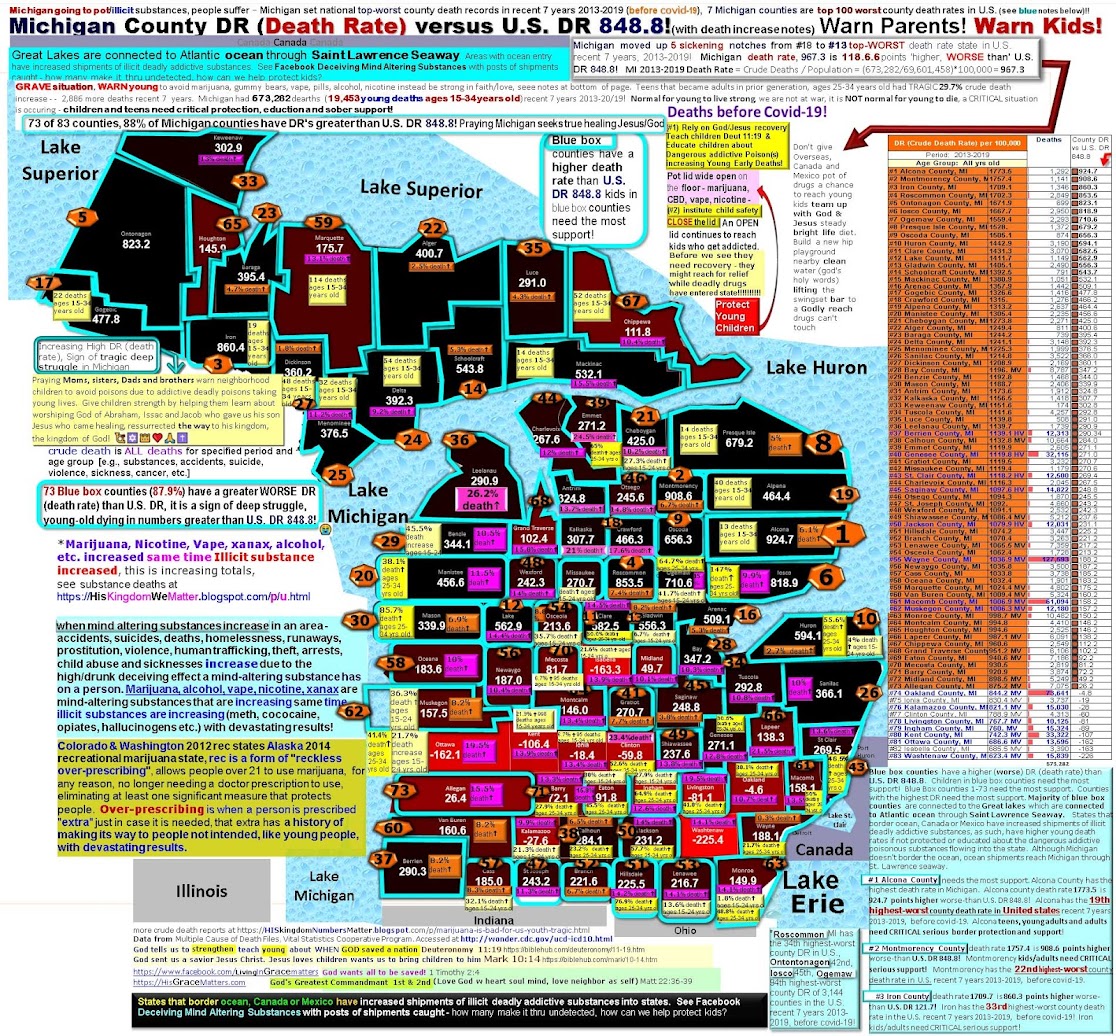
  • Recent 7 years 2013-201973 counties have critical DRs (death rates) higher, WORSE than DR 848.8, Deaths not due to covid-19, < deaths prior to covid-19 >
  • Critical Counties increased 2.8%= ((recent-prior)/prior)*100 = ((73-71)/71)*100 = 2.8%  increase  in critical DR counties in Michigan.  Critical Counties have a DR greater than U.S. DR.  
  • 56 counties had HORRIFIC DR (death rate) increase of 100+ points recent 7 years:  56 divide that by total county count 83 = 67.5%  Michigan counties had DR increase of 100+ points!
  • 80 counties had TRAGIC DR (death rate) increase of 40+ points recent 7 years:  80 divide that by total county count 83 = 96.4% Michigan counties had DR increase of 40+ points!
  • 81 counties have CRITICAL DEATH RATE INCREASE - recent 7 years DR (death rate) minus prior 7 years DR ! (2013-2019 - 2006-2012) 97.6% of Michigan counties (81 counties) had Sad Critical Death rate-+ increase recent seven years:  81 divide that by total county count 83 = 97.6% 
  • 81 counties have CRITICAL DEATH RATE INCREASE recent 7 years DR (death rate) minus prior 7 years DR ! (2013-2019 - 2006-2012)  
  •  counties have CRITICAL 
  • 78 counties have CRITICAL death INCREASE recent 7 years versus prior 7 years!

Michigan is so critical, it has 6 top NATIONAL WORST counties!  5 Top 75 worst death rate counties in U.S. recent 7 years 2013-2019 (Signs of critical serious struggle, signs of state needing to turn back to  Jesus/ God) rely on God, not substances, no more tears stop the destruction  only 10 counties left with death rates lower than U.S. 1 John 2:5 But whoever keeps his word, in him truly the love of God is perfected. By this we may know that we are in him:
  • Alcona County, MI (#1 worst MI DR#19 worst U.S. DR)
  • Montmorency County, MI (#2 worst MI DR, #22 worst U.S. DR)
  • Iron County, MI (#3 worst MI DR, #33 worst U.S. DR)
  • Roscommon County, MI (#4 worst MI DR, #34 worst U.S. DR)
  • Ontonagon County, MI (#5 worst MI DR, #42 worst U.S. DR)
  • Iosco County, MI (#6 worst MI DR, #45 worst U.S. DR)

Calling all Christians in Michigan to build the Kingdom of God for children, the Kingdom of God is at hand, time for Michigan to turn to God/Jesus for support, fill up the churches - turn away from false idols which bring destruction and early death. Alcona and Wayne County kids especially need support to help the very young avoid substances completely as they enter teen years, change adult use to 35 years old, to get substances away from kids, grandfather in current such as when changing drinking age from 18 to 21 years old.

Michigan counties sorted by Death Rate (Worst to best) 2013-2019.

All 73 red light counties are critical, some deaths are young kid deaths, kids need salvation education, sober protection and support to stop kids from stepping into the substance situation! Many kids have stepped into substance situation and are suffering hard addiction at a young age, help kids to church, places that support sobriety, prevent early deaths!Purple (Fushia) indicates top 20 death increase recent 7 years 2013-2019. Orange indicates critical DR (death rate) greater than U.S. Orange Light Blue Font indicates critical death rate and top 7 worst death rate increase recent 7 years.  Orange w Dark Blue Font indicates critical death rate and top 8-15 worst death rate increase recent 7 years. Orange w Purple Font indicates critical death rate and top 16-21 worst death rate increase recent 7 years.   Black with Orange Font  indicates critical DR greater than U.S. with critical DR (death rate) increase recent 7 years,  Black w White font  indicates critical DR increase recent 7 years


Counties Sorted Alphabetical

Michigan Crude Deaths 2013-2019, 7 Year Span = 673,282

2.9% of Michigan deaths are between ages 15-34 years old (19,453 ages 15-34 years old deaths recent 7 years, 2013-2019) protect people, end marketing of mind-altering substances in social media, news, store signs, exalt God, exalt Jesus Christ our savior, not substances.  Turn to God, do not let the enemy run roughshod over people, if we do not allow it, it ceases to happen.  
12.5% of Michigan deaths are between ages 0-54 years old (84,493 ages 0-54 years old recent 7 years, 2013-2019)  
__________________________________________________
Deaths lost per day
Michigan lost residents all ages to a death at the rate of 264 deaths per day during 2013-2019 = 673,282 crude deaths / 7 years = 96183.1428571429 deaths per year  / 52 weeks per year = 
1849.67582417582 deaths per week during years 2013-2019.  = / 365 days per year = 
263.515459882583 crude deaths per day during years 2013-2019.

Michigan lost young people, teens and young adults ages 15-34 years old to a death at the rate of 7.614 deaths per day during 2013-2019 = 19,453 deaths / 7 years = 2779 deaths per year  / 365 days per year = 7.613699 crude deaths per day during years 2013-2019 = 2779 deaths per year  / 52 weeks per year = 
53.4 deaths per week during years 2013-2019.
________________________________________________________________
Michigan death rate, 967.3 is 118.6 points 'higher, WORSE than' U.S. DR 848.8!
Michigan had significant 9.5% crude death increase all-ages 2013-2019 vs 2006-2012 - - - -  58,189 more crude deaths in the recent 7 Year Span  2013-2019 vs 2006-2012 = 673,282 - 615,093 = 58,189.    Michigan had 673,282  deaths recent 7 years, 2013-2019.

Michigan crude death rate increased significantly critical 82.7 points comparing recent 7 year crude death rate  to prior 7, 2013-2019 vs 2006-2012 death rates = 967.339 - 884.656 = 82.683 crude death rate point increase in the recent 7 year period.

Calculation for Percent Change = Death increase/decrease = ((New Value - Old Value)/ Old Value )*100 =  9.5% =Michigan ((2013-2019 Crude deaths - 2006-2012 Crude deaths ) / (2006-2012 Crude deaths ))*100  = ((673,280 - 615,091) / ( 615,091))*100 = ((58,189)  / ( 615,091))*100  = 9.5%
2013-2019 Death Rate = Crude Deaths / Population = (673,282 / 69,601,458)*100,000 = 967.3
2006-2012 Death Rate = Crude Deaths / Population = (615,093 / 69,529,032)*100,000 = 884.7
Population % Change = ((New-Old)/Old)*100 = ((69601458-69529032)/69529032)*100 = .1%
Population Difference = 72,426
Death Rate recent if Population was same as 2006-2012 = 968.3

Michigan, like other states bordering the St. Lawrence seaway, had CRITICAL crude death rate increase as illicit substances increase through port cities the same time marijuana, vape, alcohol, tobacco and xanax increase, this is increasing young deaths which increases overall state deaths, Michigan had CRITICAL significant 82.7 point death rate increase recent 7 year death rate versus prior 7 years, 2013-2019 vs 2006-2012 death rates = 967.3 - 884.7 = 82.7 death rate point increase in the recent 7 yr period. 

Every age group in Michigan is critical, see table below.  Age groups operated at a worse death rate than nation INDICATES GREAT SUFFERING, red light indicates critical MI age group death rate points above U.S. death rate!  The number of deaths and critical counties that need sober protection support are indicated for each age group for churches to prioritize support. Counties with horrific DR (death rate) increase of 100+ points and DR increase of 40+ points need the most support, see county list below.

Top 7 Highest Worst County Death Rates recent 7 years:
#1 worst Alcona County, MI death rate is critical 924.7 points higher WORSE than U.S. DR 848.8! 
#2 Montmorency County, MI  908.6 points higher WORSE than U.S. DR 848.8!, 
#3 Iron County, MI 860.4 points higher WORSE than U.S. DR 848.8!, 
Roscommon County, MI 853.5 points higher WORSE than U.S. DR 848.8!, 
#5 Ontonagon County, MI 823.2 points higher WORSE than U.S. DR 848.8!, 
#6 Iosco County, MI 818.9 points higher WORSE than U.S. DR 848.8!, 
#7 Ogemaw County, MI 710.6  points higher WORSE than U.S. DR 848.8!  - these top 7 worst DR counties are CRITICAL, kids in these counties need EMERGENCY sober protection, salvation education and support!   All 73 red light counties are critical, salvation education, sober protection and support to stop kids from stepping into the substance situation! Many kids have stepped into substance situation and are suffering hard addiction at a young age - THIS is horrible, praying we turn to God for peace and strength, help all kids to church, places that support sobriety, prevent early death in Jesus name!

Top 7 Highest Worst DR HORRIFIC (Death Rate) INCREASE counties - comparing recent DR 7 years minus prior 7 years DR:
#1 Ogemaw County, MI DR (death rate) increased 256.8 points recent 7 years! 
#2 Leelanau County, MI DR (death rate) increased 232.2 points!, 
#3 Crawford County, MI DR (death rate) increased 226.6 points!, 
#4 Mackinac County, MI DR (death rate) increased 223.4 points, 
#5 Emmet County, MI DR (death rate) increased 209.6 points, 
#6 Alcona County, MI DR (death rate) increased 205.6 points, 
#7 Montmorency County, MI DR (death rate) increased 202.1 points - these top 7 worst DR (death rate) INCREASE counties are CRITICAL, kids in these counties need EMERGENCY sober protection,  salvation education and support!

Top 7 Highest Worst Death Increase counties recent 7 years:
#1 Leelanau worst Hardest hit DEATH INCREASE is Leelanau County, MI death increased 26.2% recent 7 years! 
#2 Emmet County, MI death increased 24.5%
#3 Clinton County, MI death increased 23.4%
#4 Lapeer County, MI death increased 21.5%
#5 Kalkaska County, MI death increased 21%
#6 Ottawa County, MI death increased 19.5%
#7 Livingston County, MI death increased 19.5% - these top 7 worst DR INCREASE counties are CRITICAL, kids in these counties need EMERGENCY sober protection, salvation education and support!

Educating kids to have no desire for mind-altering substances by telling the truth while introducing Jesus/God's amazing gifts, love, forgiveness, healing, wisdom, faith and strength - gives kids a new Kingdom of God playground dealers can't destroy. 

Top 7 Most Death counties recent 7 years:
Immersing counties with highest deaths, with support, breaks dealers' finances.  These 7 counties account for 358,928 deaths in Michigan, 53.3% of deaths recent 7 years 2013-2019! Educating kids to have no desire for mind-altering substances by telling the truth while introducing Jesus/God's amazing gifts, love, forgiveness, healing, wisdom, faith and strength - gives kids a new Kingdom of God playground dealers can't destroy.  
#1 Wayne county, MI, 127,593 deaths recent 7 years, 
#2 Oakland County, MI 73,641 deaths, 
#3 Macomb County, MI 61,094 deaths, 
#4 Kent County, MI 33,322 deaths, 
#5 Genesee County, MI 32,115 deaths, 
#6 Washtenaw County, MI 15,839 deaths, 
#7 Ingham County, MI 15,324 deaths - these 7 counties are CRITICAL, kids in these counties need EMERGENCY sober protection, salvation education and support!

Top 15 Most Death counties recent 7 years:
Immersing counties with highest deaths, with support, breaks dealers' finances.  These 15 counties account for 462,063 deaths in Michigan, 74.5% of deaths recent 7 years 2013-2019. Educating kids to have no desire for mind-altering substances by telling the truth while introducing Jesus/God's amazing gifts, love, forgiveness, healing, wisdom, faith and strength - gives kids a new Kingdom of God playground dealers can't destroy.  
#1 Wayne county, MI, 127,593 deaths recent 7 years, 
#2 Oakland County, MI 73,641 deaths, 
#3 Macomb County, MI 61,094 deaths, 
#4 Kent County, MI 33,322 deaths, 
#5 Genesee County, MI 32,115 deaths, 
#6 Washtenaw County, MI 15,839 deaths, 
#7 Ingham County, MI 15,324 deaths
#8 Kalamazoo County, MI 15,030 deaths, 
#9 Saginaw County, MI 14,822 deaths, 
#10 Ottawa County, MI 13,595 deaths, 
#11 St. Clair County, MI 12,500 deaths, 
#12 Berrien County, MI 12,313 deaths, 
#13 Muskegon County, MI 12,180 deaths, 
#14 Jackson County, MI 12,031 deaths, 
#15 Calhoun County, MI 10,664 deaths -- these 15 counties are CRITICAL, kids in these counties need EMERGENCY sober protection, salvation education and support!

Education and support stops seepage:  Prior 7 year  (2006-2012) top 3 critical counties without support, not only got worse, the situation spread to other counties!  
Iron County, MI had the highest death rate prior 7 years (2006-2012) 1371 deaths, 
Alcona County, MI had the 2nd highest death rate in Michigan prior 7 years (2006-2012) 1218 deaths, Ontonagon County, MI had the 3rd highest death rate in Michigan prior 7 years (2006-2012) 747 deaths.  If residents had known the truth about these critical counties, how many lives would have been saved in the next 7 years  - instead the critical situation worsened and spread to neighboring counties.  When mind altering substances increase in an area - accidents, suicides, deaths, homelessness, runaways, prostitution, violence, human trafficking, theft, arrests, child abuse and sicknesses increase due to the high/drunk deceiving effect a mind-altering substance has on a person. Marijuana, crack weed, alcohol, CBD, kratom, vape, nicotine, Xanax are mind-altering substances that are increasing same time illicit substances are increasing (meth, cocaine, opiates, mushrooms, hallucinogens etc.) with devastating results.  As such, Michigan lost  673,282 people recent 7 years 2013-2019.  Many young parents need support, are accidently suffering hard addiction due to illicit infiltration, potency increase and over-prescribing (medicinal/recreational are overprescribing).  Weed, vape, tobacco, combined with alcohol to double addiction same time illicit substances increase, with tragic results.  When county death rates increase by more than 40 points in a seven year period it is a sign of addiction and early death.   Instead, what works is new life through Jesus Christ, salvation, the New Birth.  God/Jesus give healing, strength, wisdom, love, joy, peace, patience, kindness, generosity, faithfulness, gentleness, self-control with no harmful side effects ,,  Galatians 5:22!  Are we supporting churches to help people, bringing the gospel to prisons?  Praying this report makes its way to people, to churches to uplift family members, provide truthful support warning parents/kids to come to know Jesus, prayer in Jesus name. 

HORRIFIC DR (DEATH rate) increase/decrease recent 7 years 2013-2019:
56 Counties with DR increase of 100+ points need most godly support:   
80 counties had Critical Death rate increase of 40+ points:  80/83 = 96.4% of Michigan counties
81 counties) had Sad Critical Death rate increase 81/83 = 97.6% of Michigan counties
#1 Ogemaw worst DR (death rate) increased 256.8 points recent 7 years! 
#2  Leelanau County, MI DR (death rate) increased 232.2 points, 
#3 Crawford County, MI DR (death rate) increased 226.6 points, 
#4 Mackinac County, MI DR (death rate) increased 223.4 points, 
#5 Emmet County, MI DR (death rate) increased 209.6 points, 
#6 Alcona County, MI DR (death rate) increased 205.6 points, 
#7 Montmorency County, MI DR (death rate) increased 202.1 points, 
#8 Iosco County, MI DR (death rate) increased 201.4 points, 
#9 Clare County, MI DR (death rate) increased 199.2 points, 
#10 Kalkaska County, MI DR (death rate) increased 190.3 points
#11 Lapeer County, MI DR (death rate) increased 186.2 points,  
#12 Lake County, MI DR (death rate) increased 175.2 points,  
#13 Genesee County, MI DR (death rate) increased 172.9 points,  
#14 Roscommon County, MI DR (death rate) increased 171.1 points,  
#15 Shiawassee County, MI DR (death rate) increased 165 points,  
#16 Sanilac County, MI DR (death rate) increased 164.8 points,  
#17 Antrim County, MI DR (death rate) increased 164.4 points,  
#18 Tuscola County, MI DR (death rate) increased 163.9 points,  
#19 St. Clair County, MI DR (death rate) increased 162.7 points,  
#20 Cheboygan County, MI DR (death rate) increased 162.2 points, 
#21 Menominee County, MI DR (death rate) increased 162 points,  
#22 Manistee County, MI DR (death rate) increased 154.2 points,  
#23 Hillsdale County, MI DR (death rate) increased 153.7 points,  
#24 Arenac County, MI DR (death rate) increased 151.9 points,  
#25 Presque Isle County, MI DR (death rate) increased 149.5 points,  
#26 Lenawee County, MI DR (death rate) increased 147.9 points,  
#27 Missaukee  County, MI DR (death rate) increased 147.8 points,  
#28 Jackson County, MI DR (death rate) increased 143.9 points,  
#29 Schoolcraft County, MI DR (death rate) increased 141.8 points,  
#30 Bay County, MI DR (death rate) increased 140.5 points, 
#31 Gladwin County, MI DR (death rate) increased 139 points, 
#32 Otsego County, MI DR (death rate) increased 138.1 points,  
#33 Monroe County, MI DR (death rate) increased 137.2 points,  
#34 Delta County, MI DR (death rate) increased 136.5 points,  
#35 Alpena County, MI DR (death rate) increased 130.8 points,  
#36 Keweenaw County, MI DR (death rate) increased 123.9 points,  
#37 St. Joseph County, MI DR (death rate) increased 120.8 points,  
#38 Clinton County, MI DR (death rate) increased 120.4 points,  
#39 Eaton County, MI DR (death rate) increased 120.2 points,  
#40 Charlevoix County, MI DR (death rate) increased 119.7 points, 
#41 Wexford County, MI DR (death rate) increased 119 points,  
#42 Montcalm County, MI DR (death rate) increased 118.9 points,  
#43 Marquette County, MI DR (death rate) increased 117.2 points,  
#44 Benzie County, MI DR (death rate) increased 116.4 points,  
#45 Chippewa County, MI DR (death rate) increased 115.3 points,  
#46 Branch County, MI DR (death rate) increased 113.9 points,  
#47 Oceana County, MI DR (death rate) increased 113.4 points,  
#48 Ontonagon County, MI DR (death rate) increased 112.9 points,  
#49 Huron County, MI DR (death rate) increased 112.3 points,  
#50 Gratiot County, MI DR (death rate) increased 110.3 points, 
#51 Mecosta County, MI DR (death rate) increased 109.8 points! 
#52 Newaygo County, MI DR (death rate) increased 106.4 points, 
#53  Baraga County, MI DR (death rate) increased 103.9 points, 
#54 Berrien County, MI DR (death rate) increased 103.4 points, 
#55 Osceola County, MI DR (death rate) increased 101.2 points, 
#56 Livingston County, MI DR (death rate) increased 101.1 points, 

CRITICAL DR (DEATH rate) 80 Counties with DR increase of 40+ points recent 7 years, needs godly support:   
#57 Ionia County, MI DR (death rate) increased 99.9 points, 
#58 Barry County, MI DR (death rate) increased 98.4 points, 
#59 Luce County, MI DR (death rate) increased 93.7 points, 
#60 Cass County, MI DR (death rate) increased 91.8 points! 
#61 Macomb County, MI DR (death rate) increased 90.6 points! 
#62 Allegan County, MI DR (death rate) increased 89.8 points, 
#63 Van Buren County, MI DR (death rate) increased 88.9 points, 
#64 Calhoun County, MI DR (death rate) increased 85.7 points, 
#65 Midland County, MI DR (death rate) increased 85.2 points, 
#66 Saginaw County, MI DR (death rate) increased 84 points, 
#67 Grand Traverse County, MI DR (death rate) increased 83.3 points, 
#68 Isabella County, MI DR (death rate) increased 76.5 points, 
#69 Oscoda County, MI DR (death rate) increased 76 points, 
#70 Muskegon County, MI DR (death rate) increased 73.9 points
#71 Alger County, MI DR (death rate) increased 70.6 points,  
#72 Iron County, MI DR (death rate) increased 70.6 points,  
#73 Ingham County, MI DR (death rate) increased 69.5 points,  
#74 Ottawa County, MI DR (death rate) increased 69.1 points,  
#75 Mason County, MI DR (death rate) increased 68.8 points,  
#76  Dickinson County, MI DR (death rate) increased 60 points,  
#77 Oakland County, MI DR (death rate) increased 55.5 points,  
#78 Wayne County, MI DR (death rate) increased 54.2 points,  
#79 Kent County, MI DR (death rate) increased 49.1 points, 
#80 Washtenaw County, MI DR (death rate) increased 49.1 points, 
#81 Kalamazoo County, MI DR (death rate) increased 36.6 points,  
#82 Houghton County, MIDR decreased -0.4 points,  
#83 Gogebic County, MIDR decreased -105.2 points, Gogebic has a high death rate, it is good it went down, it has a lot more to go.)

Age Division % Change

ages 15-24 years old versus prior age group ages 5-14 years old:
Recent seven years 2013-2019, Michigan had significant death increase for persons aged 15-24 years old, compared to earlier age group age 5-14 years old.  Teens and young adults ages 15-24 years old had a 443% death increase compared to earlier age group age 5-14 years old.  There were 5,582 more deaths age 15-24 year old age versus the age 5-14 year old age group.  Calculation for percent change is ((New Value - Old Value) / Old Value)*100 = ((Age 15-24 year old Crude deaths - Age 5-14 year old Crude deaths)/Age 5-14 year old Crude deaths)*100 = ((6842 - 1260)/1260)*100 = 443% increases in Crude deaths for persons aged 15-24 years old compared to earlier age group age 5-14 years old.

Michigan  15-34 map  15-34  Below are the top 7 Michigan ages 15-34 years old death volume counties recent 7 years 2013-2019.  Immersing counties with highest deaths with support breaks dealers' finances.  These 7 counties account for 12,057 young deaths in Michigan, 62% of young deaths recent 7 years 2013-2019. Educate kids in these counties to have no desire for mind-altering substances by telling the truth while introducing a few of Jesus/God's amazing gifts, love, wisdom, forgiveness, healing and strength - gives kids a new Kingdom of God playground dealers can't destroy.  The #1 county with the most DEATHs recent 7 years is Wayne County, MI, 5,095 young deaths ages 15-34 years old!, #2 Oakland County, MI, 1,884 young deaths #3 Macomb County, MI, 1,832 young deaths#4 Genesee County, MI, 1,137 young deaths #5 Kent County, MI, 998 young deaths #6 Ingham County, MI, 559 young deaths#7 Washtenaw County, MI 552 young deaths - these 7 counties are CRITICAL, kids in these counties need EMERGENCY sober protection, salvation education and support!

Population Note for ages 15-34 years old :
  • Livingston 21.8%  death increase ages 15-34 years old.  Livingston 2013-2019 Death Rate 91.36 would have been 100.46 if Livingston didn't have extraordinary high ages 15-34 years old  10%  population increase, it's death rate would have been marked as critical, greater than U.S. ages 15-34 years old death rate 96.1.
  • Ottowa 32.5% death increase ages 15-34 years. Ottowa's 2013-2019 Death Rate is  57.49 would have been 62.99 if Ottawa didn't have extraordinary high ages 15-34 years old 9.6% population increase


______________________________________
15-24 years old Deaths (15-24 years old county link)
7 Year Span Comparison 2013-2019
Michigan teens young adults death rate ages 15-24 years old is CRITICAL 71.1 is 1.3 points higher/WORSE than U.S. DR 15-24 years old 69.8.
Michigan teens young adults ages 15-24 years had a -5.9% crude death decrease   2013-2019 vs 2006-2012 - - - -  -431 less deaths in the recent 7 Year Span vs prior 7 years, 2013-2019 vs 2006-2012 = 6,842 - 7,273 = -431 less crude deaths in the recent 7 Year Span.  Michigan teens and young adults Ages 15-24 years old had 6,842 deaths in the recent 7 years, 2013-2019.

Age Division % Change Recent 7 years 2013-2019, Michigan had horrific death increase for persons aged 15-24 years old, compared to earlier age group age 5-14 years old.  Teens and young adults ages 15-24 years old had a 443% death increase compared to earlier age group age 5-14 years old.  

There were 5,582 more Michigan deaths ages 15-24 year old versus earlier ages 5-14 year old age group!

Calculation for death increase is percent change = ((NewValue - OldValue) / OldValue)*100 = ((Age15-24deaths - Age5-14deaths)/Age5-14deaths)*100 = ((6842 - 1260)/1260)*100 = 443% increase in deaths for persons ages 15-24 years old compared to earlier age group age 5-14 years old.

Michigan ages 15-24 years olds moved from a critical death rate 0.8 points greater WORSE than U.S. DR 72.3 to a MORE critical death rate 1.3 points greater WORSE than U.S. DR 69.8.  Prior 7 years 8-14 years ago 2006-2012 children in Michigan had an ages 15-24 years old death rate 0.8 points greater than worse than U.S. ages 15-24 years old DR 72.3  Prior 7 years 8-14 years ago 2006-2012, 34 counties had critical DRs (death rates) greater WORSE than DR 72.3   Recent 7 years 2013-2019, 37 counties have critical DRs (death rates) higher, WORSE than U.S. DR 69.8.  Critical Counties have a DR greater than U.S. DR.   Recent 7 years Michigan Ages 15-24 years 

37 counties have CRITICAL ages 15-24 years old death rates greater than U.S. ages 15-24 years old DR 69.8!  Deaths not due to covid-19, < deaths prior to covid-19 >
29 counties have CRITICAL ages 15-24 years old DEATH RATE INCREASE recent 7 years DR (death rate) minus prior 7 years DR ! (2013-2019 - 2006-2012) 
20 counties have CRITICAL ages 15-24 years old death INCREASE recent 7 years versus 7 years prior!
Critical Counties increased 8.8%= ((recent-prior)/prior)*100 = ((37-34)/34)*100 = 8.8%  increase in ages 15-24 years old critical DR counties in Michigan.
3 counties Critical ages 15-24 yrs old  Death rate increase of 40+ points recent 7 years:  3/67 = 4.5% 
29 counties Sad ages 15-24 yrs old Death rate increase recent 7 years:  16/67 = 43.3% 

Michigan teens and young adults ages 15-24 years crude death rate decreased -1.9 points comparing recent 7 year crude death rate  to prior 7, 2013-2019 vs 2006-2012 death rates = 71.1 - 73. = -1.9 death rate point increase in the recent 7 yr period.

3 Hot Pink counties have  ages 15-24 years old deaths of 10 or more recent 7 years with PRIOR 7 years sub-national totals with 9 or less deaths, which are not published. All the sudden, these counties have young adult deaths recent 7 years where they didn't display deaths prior 7 years - no warning!   Iron county not listed in prior 7 year report now has the highest ages 15-24 year old death rate in Michigan!  Teens/young adults stepped into substance situation, suffering hard addiction at a young age!
Iron County, MI, 10 deaths recent 7 years, death rate 75.1 points greater/worse than U.S. ages 15-24 DR 69.8 
Missaukee County, MI, 10 deaths recent 7 years, death rate 12.8  points greater/worse than U.S. ages 15-24 DR 69.8 
Leelanau County, MI, 10 deaths recent 7 years, death rate (3.2) points lower/better than U.S. ages 15-24 DR 69.8   
parents and kids in these counties need EMERGENCY sober protection, salvation education and support! 
Educating residents about critical areas and age groups, warns people and save lives.  Reports pinpoint critical areas that need support so we can work together to save lives to prevent future deaths.  When we do not help troubled areas the problem seeps into other age groups and counties.  Dickinson county had the highest ages 15-24 death rate in Michigan prior seven years (2006-2012) 31 deaths ages 15-24, Otsego county had the 2nd highest ages 15-24 death rate in Michigan prior seven years (2006-2012) 29 deaths ages 15-24, Kalkaska County, MI had the 3rd highest ages 15-24 death rate in Michigan prior seven years (2006-2012) 17 deaths. When we do not help the top worse counties, the problem explodes into neighboring counties.  If Michigan had known, many young lives would have been saved 2013-2019 - instead Michigan lost 6,842 teens/young adults ages 15-24 in the next seven years 2013-2019. Teens and young adults are accidently suffering hard addiction due to potency increaseillicit substances entering great lake ports and over-prescribing (medicinal, recreation and vape are over-prescribing).  Are churches and schools working to warn parents and uplift family members, support, warn parents/kids?  Are we asking how we can support bringing people to church, supporting churches to help people?  These critical areas need help!  How do churches support juvenile detention, recovery centers and schools, EMERGENCY sober protection, salvation education and support!

Top 7 Highest Worst ages 15-24 years old Death Rates recent 7 years:
#1 Iron County, MI - Iron ages 15-24 death rate is critical 75.1 points higher WORSE than U.S. DR 69.8! ,
#2 Benzie County, MI ages 15-24 death rate is critical 59.8 points higher WORSE than U.S. DR 69.8!, 
#3 Dickinson County, MI ages 15-24 death rate is critical 51.6 points higher WORSE than U.S. DR 69.8!, 
#4 Ogemaw County, MI ages 15-24 death rate is critical 42.8 points higher WORSE than U.S. DR 69.8!, , 
#5 Huron County, MI ages 15-24 death rate  is critical 40.4 points higher WORSE than U.S. DR 69.8!, 
#6 Wayne County, MI ages 15-24 death rate is critical 37.3 points higher WORSE than U.S. DR 69.8!, 
#7 Manistee County, MI ages 15-24 death rate is critical 36.5 points higher WORSE than U.S. DR 69.8!, - these top 7 worst DR counties are CRITICAL, kids in these counties need EMERGENCY sober protection, salvation education and support!  All 37 red light counties are critical, need salvation education, sober protection and support to prevent the next generation of kids from stepping into the substance situation! Many kids stepped into substance situation and are suffering hard addiction at a young age - help kids to church, places that support sobriety, prevent early deaths!  Can we do more to support churches support juvenile detention, recovery centers, prisons and schools - kids need EMERGENCY sober protection, salvation education and support!

Top 7 Highest Worst ages 15-24 years old DR (Death Rate) INCREASE counties - comparing recent 7 year DR minus prior 7 years DR:
#1 Manistee County, MI DR HORRIFIC (death rate) increased 43.5 points recent 7 years! 
#2 Ogemaw County, MI DR (death rate) increased 40.9 points, 
#3 Benzie County, MI DR (death rate) increased 40.6 points, 
#4 Osceola County, MI DR (death rate) increased 31.3 points, 
#5 Muskegon County, MI DR (death rate) increased 28.5 points, 
#6 Cass, County, MI DR (death rate) increased 22.7 points, 
#7 Cheboygan County, MI DR (death rate) increased 21.7 points - these top 7 worst DR (death rate) INCREASE counties are CRITICAL, kids in these counties need help getting to church, how do churches support juvenile detention, recovery centers and schools, EMERGENCY sober protection, salvation education and support!

Top 7 Highest Worst  ages 15-24 years old Death Increase counties recent 7 years:
#1 Manistee HARDEST HIT ages 15-24 years old DEATH INCREASED 66.7% recent 7 years! 
#2 Benzie County, MI ages 15-24 years old death increased 45.5%, 
#3 Ogemaw County, MI ages 15-24 years old death increased 41.7%
#4 Muskegon County, MI ages 15-24 years old death increased 36.3%
#5  Osceola County, MI ages 15-24 years old death increased 35.7%
#6 Cass County, MI death ages 15-24 years old increased 32.1%
#7 Eaton County, MI ages 15-24 years old death increased 30% - these top 7 worst DR INCREASE counties are CRITICAL, kids in these counties need help getting to church, how do churches support juvenile detention, recovery centers and schools, EMERGENCY sober protection, salvation education and support!

Immersing the top 7 counties with the most ages 15-24 years old deaths, with Godly support, supports lives of children, creates a heavenly place, while breaking dealers' finances.  These 7 counties account for 4,139 deaths in Michigan, 60.5% of ages 15-24 year old deaths recent 7 years 2013-2019. Educating kids to have no desire for mind-altering substances by telling the truth while introducing Jesus/God's amazing gifts, love, forgiveness, healing, wisdom, faith and strength - gives kids a new Kingdom of God playground dealers can't destroy.  
#1 Wayne County, MI had the most ages 15-24 years old DEATHs, 1,760 deaths
#2 Oakland County, MI 665 ages 15-24 years old deaths
#3 Macomb County, MI 617 ages 15-24 years old deaths
#4 Genesee County, MI 394 ages 15-24 years old deaths
#5 Kent County, MI 333 ages 15-24 years old deaths
#6 Ingham County, MI 188 ages 15-24 years old deaths
#7 Kalamazoo County, MI 182 ages 15-24 years old deaths - these 7 counties are CRITICAL, kids in these counties need help getting to church, how do churches support juvenile detention, recovery centers and schools, EMERGENCY sober protection, salvation education and support!

Immersing the top 15 counties with the most ages 15-24 years old deaths, with Godly support, supports lives of children, creates a heavenly place, while breaking dealers' finances.  These 15 counties account for 5,187 deaths in Michigan, 75.8% of ages 15-24 year old deaths recent 7 years 2013-2019. Educating kids to have no desire for mind-altering substances by telling the truth while introducing Jesus/God's amazing gifts, love, forgiveness, healing, wisdom, faith and strength - gives kids a new Kingdom of God playground dealers can't destroy.   
#1 Wayne County, MI 1,760 ages 15-24 years old DEATHs, recent 7 years 2013-2019
#2  Oakland County, MI 665 ages 15-24 years old deaths
#3 Macomb County, MI 617 ages 15-24 years old deaths
#4 Genesee County, MI 394 ages 15-24 years old deaths
#5 Kent County, MI 333 ages 15-24 years old deaths
#6 Ingham County, MI 188 ages 15-24 years old deaths
#7 Kalamazoo County, MI 182 ages 15-24 years old deaths
#8 Washtenaw County, MI 180 ages 15-24 years old deaths
#9 Saginaw County, MI 154 ages 15-24 years old deaths
#10 Ottawa County, MI 140 ages 15-24 years old deaths
#11 Muskegon County, MI 139 ages 15-24 years old deaths
#12 Monroe County, MI 113 ages 15-24 years old deaths
#13 Berrien County, MI 108 ages 15-24 years old deaths
#14 Livingston County, MI 107 ages 15-24 years old deaths
#15 St. Clair County, MI 107 ages 15-24 years old deaths - these 15 counties are CRITICAL, kids in these counties need help getting to church, how do churches support juvenile detention, recovery centers and schools, EMERGENCY sober protection, salvation education and support!

Top 7 Highest Worst ages 15-24 years old DR (Death Rate) INCREASE counties - comparing recent DR 7 years minus prior 7 years DR:
#1 Manistee County, MI had worst ages 15-24 years old DEATH RATE INCREASEManistee DR (death rate) increased 43.5 points recent 7 years! 
#2 Ogemaw County, MI ages 15-24 years old DR (death rate) increased 40.9 points, 
#3 Benzie County, MI ages 15-24 years old DR (death rate) increased 40.6 points, 
#4 Osceola County, MI ages 15-24 years old DR (death rate) increased 31.3 points, 
#5 Muskegon County, MI ages 15-24 years old DR (death rate) increased 28.5 points, 
#6 Cass, County, MI ages 15-24 years old DR (death rate) increased 22.7 points, 
#7 Cheboygan County, MI ages 15-24 years old DR (death rate) increased 21.7 points - these top 7 worst DR (death rate) INCREASE counties are CRITICAL, , kids in these counties need help getting to church, how do churches support juvenile detention, recovery centers and schools, EMERGENCY sober protection, salvation education and support!

Top 7 Best  ages 15-24 years old  DR (Death Rate) DECREASE counties - recent 7 year DR versus prior 7 years DR:
#1 Otsego 8 - 14 years ago (2006-2012) Otsego had one of the highest worst 141.1 death rates, now 7 years later ages 15-24 years old DR (death rate) decreased -81 points recent 7 years.  What caused the horrific high ages 15-24 years old  deaths in prior years? Did churches, hospitals, schools and doctors work together to support young to bring the death rate down?  
#2 Best DR decrease Kalkaska County, MI DR (death rate) decreased -31.1 points, 
#3 Best DR decrease Grand_Traverse County, MI DR (death rate) decreased -30.9 points, 
#4 Best DR decrease Mason County, MI DR (death rate) decreased -28.2 points, 
#5 Best DR decrease Dickinson County, MI DR (death rate) decreased -24.3 points, 
#6 Best DR decrease Emmet County, MI DR (death rate) decreased -24.3 points, 
#7 Best DR decrease Sanilac County, MI DR (death rate) decreased -23.3 points - these top 7 Best DR (death rate) DeCREASE counties continue to be CRITICAL, teens young adults continue to need EMERGENCY sober protection, salvation education and support!

Michigan teens young adults need support and GREAT WARNING, Michigan had 443% death increase for ages 15-24 years old, compared to earlier age group age 5-14 years old.  There were 5,582 more deaths ages 15-24 year old age versus the earlier age group ages 5-14 year old age group during recent 7 years 2013-2019.  

Calculation for death increase/decrease is percent change which is ((New Value - Old Value) / Old Value)*100 = ((Age 15-24 year old deaths - Age 5-14 year old deaths)/Age 5-14 year old deaths)*100 = ((6842 - 1260)/1260)*100 = 443% increases in death for persons aged 15-24 years old compared to earlier age group age 5-14 years old!

3 counties Critical ages 15-24 years old Death rate increase of 40+ points recent 7 years:  3 divide that by total county count 67 = 4.5%% 
#1 Manistee County, MI HORRIFIC DR (death rate) increased 43.5 points recent 7 years! 
#2 Ogemaw County, MI death rate increased 40.9 points, 
#3 Benzie County, MI death rate increased 40.6 points, 
29 counties Critical ages 15-24 years old Death rate increase recent 7 years:  29 divide that by total county count 67 = 43.3% 
#4 Osceola County, MI death rate increased 31.3 points, 
#5 Muskegon County, MI death rate increased 28.5 points, 
#6 Cass County, MI death rate increased 22.7 points, 
#7 Cheboygan, County, MI death rate increased 21.7 points, 
#8 Eaton County, MI death rate increased 18 points, 
#9 Delta County, MI death rate increased 16.2 points, 
#10 Gladwin County, MI death rate increased 13.5 points
#11 Huron County, MI death rate increased 12.7 points! 
#12 Lenawee County, MI death rate increased 12.6 points, 
#13 Crawford, County, MI death rate increased 10.7 points, 
#14 Charlevoix County, MI death rate increased 10.5 points, 
#15 Macomb County, MI death rate increased 10.3 points, 
#16 Ingham County, MI death rate increased 9 points, 
#17 Monroe County, MI death rate increased 8.1 points, 
#18 Alpena County, MI death rate increased 7.5 points, 
#19 Isabella County, MI death rate increased 7.5 points, 
#20 Kalamazoo County, MI death rate increased 7.3 points
#21 Branch County, MI death rate increased 6.6 points! 
#22 Berrien County, MI death rate increased 5.1 points, 
#23 Calhoun County, MI death rate increased 4.8 points, 
#24 Ottawa County, MI death rate increased 3.6 points, 
#25 Wexford County, MI death rate increased 2.4 points, 
#26 Montcalm County, MI death rate increased 1.1 points, 
#27 Jackson County, MI death rate increased 0.9 points, 
#28 Houghton County, MI death rate increased 0.9 points, 
#29 Saginaw County, MI DR decreased 0 points, 
#30 Kent, County, MI DR decreased -1.2 points
#31 Clinton County, MI DR decreased -1.4 points! 
#32 Bay County, MI DR decreased -1.5 points, 
#33 Marquette County, MI DR decreased -1.8 points, 
#34 Iosco County, MI DR decreased -2.4 points, 
#35 Oakland County, MI DR decreased -3 points, 
#36 St. Clair County, MI DR decreased -3.1 points, 
#37 Genesee County, MI DR decreased -3.5 points, 
#38 St. Joseph County, MI DR decreased -4.8 points, 
#39 Wayne County, MI DR decreased -5 points, 
#40 Clare County, MI DR decreased -5.1 points
#41 Livingston County, MI DR decreased -5.6 points! 
#42 Washtenaw County, MI DR decreased -6.2 points, 
#43 Ionia County, MI DR decreased -8 points, 
#44 Shiawassee County, MI DR decreased -8.5 points, 
#45 Oceana County, MI DR decreased -9.4 points, 
#46 Hillsdale County, MI DR decreased -9.6 points, 
#47 Gratiot County, MI DR decreased -9.9 points, 
#48 Midland County, MI DR decreased -10 points,
#49 Allegan County, MI DR decreased -11.6 points, 
#50 Van Buren County, MI DR decreased -14.1 points
#51 Chippewa County, MI DR decreased -14.6 points! 
#52 Mecosta County, MI DR decreased -15.4 points, 
#53 Tuscola County, MI DR decreased -17.7 points, 
#54 Lapeer County, MI DR decreased -20 points, 
#55 Newaygo County, MI DR decreased -20.2 points, 
#56 Roscommon County, MI DR decreased -20.9 points, 
#57 Barry County, MI DR decreased -21.3 points, 
#58 Sanilac County, MI DR decreased -23.3 points, 
#59 Emmet County, MI DR decreased -24.3 points, 
#60 Dickinson County, MI DR decreased -24.3 points
#61 Mason County, MI DR decreased -28.2 points! 
#62 Grand_Traverse County, MI DR decreased -30.9 points, 
#63 Kalkaska County, MI DR decreased -31.1 points, 
#64 Otsego County, MI DR decreased -81 points

Death Increase/Decrease Calculation = Death Percent Change = ((New Value - Old Value)/ Old Value )*100 =  -5.9% = ((2013-2019 Crude deaths - 2006-2012 Crude deaths ) / (2006-2012 Crude deaths ))*100  = ((6,842 - 7,273) / ( 7,273))*100 = ((-431)  / ( 7,273))*100  = -5.9% death increase for ages 15-24 years old
2013-2019 Death Rate = Crude Deaths / Population = (6842 / 9622730)*100,000 = 71.1
2006-2012 Death Rate = Crude Deaths / Population = (7273 / 9956204)*100,000 = 73
Population % Change = -3.35%
Population Difference = -333474
Death Rate if Population was same as 2006-2012 = 68.7
______________________________________
7 Year Span Comparison 2013-2019

Michigan ages 25-34 years old death rate 144.3 is HORRIFIC CRITICAL is 22.6 points 'higher, WORSE than' U.S. ages 25-34 years old DR 121.7.

Michigan ages 25-34 years olds moved from a critical death rate 117.49 12 points greater WORSE than U.S. ages 25-34 DR 105.5 to a critical death rate 144.3  22.6 points greater WORSE than U.S. ages 25-34 DR 121.7 recent 7 years 2013-2019.  

Michigan young adults ages 25-34 years  old crude death rate increased 26.8 points comparing recent 7 year crude death rate  to prior 7, 2013-2019 vs 2006-2012 death rates = 144.3 - 117.5 = horrific, critical, 26.8 death rate point increase in recent 7 yr period.  crude deaths is all deaths (e.g., sickness, accidents, suicide, substances, etc.)

Prior 7 years 8-14 years ago 2006-2012, 45 counties had critical DRs (death rates) greater WORSE than U.S.  

Recent 7 years 2013-2019 48 counties have critical DRs (death rates) higher, WORSE than U.S.  

Critical Counties increased 6.7%= ((recent-prior)/prior)*100 = ((48-45)/45)*100 = 6.7%  increase in ages 25-34 years old critical DR counties in Michigan. 
Critical Counties have a DR greater than U.S. DR (death rate) 
48 MI counties have CRITICAL ages 25-34 years old death rates greater than U.S. ages 25-34 years old  DR 121.7!  Deaths not due to covid-19, 
53 counties have CRITICAL  ages 25-34 years old DEATH RATE INCREASE recent 7 years DR (death rate) minus prior 7 years DR ! (2013-2019 - 2006-2012) 
54 counties have CRITICAL  ages 25-34 years old death INCREASE recent 7 years versus prior 7 years!
2 counties Sickening ages 25-34 years old Death rate increase of 100+ points recent 7 yrs:  2 divided by total county count 72 =2.8% (Crawford & Iosco)
15 counties Horrific ages 25-34 years old Death rate increase of 40+ points recent 7 years:  15 divide by total county count 72 =20.8%53 counties Critical ages 25-34 years old Death rate increase recent 7 years:  53 divide by total county count 72=73.6%
Ages 25-34 years old had 84% death increase compared to earlier age group ages 15-24 years old, there were 5,769 more deaths ages 25-34 year old versus the earlier ages 15-24 years old age group deaths!  
Calculation for death increase/decrease is age division percent change which is = ((Ages_25-34_deaths - Ages_15-24_deaths)/Ages_15-24_deaths)*100 = ((12,611 - 6,842)/6,842)*100 = 84% death increase ages 25-34 years old compared to earlier age group ages 15-24 years old!

4 Hot Pink counties have  ages 25-34 years old deaths of 10 or more recent 7 years with PRIOR 7 years sub-national totals with 9 or less deaths, which are not published.  All the sudden, these counties have young adult deaths recent 7 years where they didn't display deaths in prior 7 years - no warning!  Arenac county not listed in prior 7 year report now has the 4th highest ages 25-34 year old death rate in Michigan! Young adults stepped into horrible substance situation,  teen crack_weed/alcohol addiction is leading right into illicit deadly substance addictionkids need help
Arenac County, MI 22 deaths recent 7 years, death rate is 92.3 points greater/worse than U.S. ages 25-34 DR 121.7  
Baraga, County, MI 14 deaths recent 7 years, death rate is 76.8  points greater/worse than U.S. ages 25-34 DR 121.7  
Mackinac County, MI 10 deaths recent 7 years, death rate is 25.9 points greater/worse than U.S. ages 25-34 DR 121.7  
Leelanau County, MI 18 deaths recent 7 years, death rate is 20.3  points greater/worse than U.S. ages 25-34 DR 121.7  
parents and kids in these counties need EMERGENCY sober protection, salvation education and support!

Reports Educate and stop seepage:  Why didn't Michigan residents know Wayne County, MI county had the highest ages 25-34 death rate in Michigan prior seven years (2006-2012) 2,741 deaths ages 25-34 years oldRoscommon county had the 2nd highest ages 25-34 death rate in Michigan prior 7 years (2006-2012) 21 deaths ages 25-34 year oldMenominee County, MI had the 3rd highest ages 25-34 death rate in Michigan prior seven years (2006-2012) 26 deaths ages 25-34 year oldResidents did not know to uplift family members, support churches / schools in area to support and warn parents and kids.  If Michigan residents had warning, many young adult lives might have been saved in the next 7 years 2013-2019 - to prevent the 12,611 ages 25-34 year old deaths that followed in recent 7 years 2013-2019.  Now that we know, let us Christians fearlessly work to remedy this situationprevent early deaths of Michigan children and young adults in Jesus name.

Michigan young adults ages 25-34 years had HORRIFIC 29.7% death increase recent 7 years  2013-2019 vs 2006-2012 - - - -  2,886 more deaths in the recent 7 years = 12,611 - 9,725 = 2,886 more deaths in recent 7 years.  Michigan Ages 25-34 years old had 12,611 deaths in recent 7 years, 2013-2019!

Young adults accidentally suffering hard addiction due to potency increaseillicit substances entering great lake ports and over-prescribing (medicinal, recreation and vape are over-prescribing).  praying in Jesus name that Michigan churches get together to support sharing services and bible study for juvenile detention, recovery centers, prisons and schools (if possible)?  If can't bring bibles in schools, then AA recovery testimonies and death numbers.  Teens need EMERGENCY sober protection, to end teen weed, to prevent the next generation from stepping into the substance mess!

High potency substances (crack weed, vape, nicotine, alcohol, xanax, ADHD meds and illicit substances {opiates, meth, cocaine, kratom, etc.} deceive the person using, prevent right thinking.  

Crawford county Michigan is most critical, Crawford has the 21st worst highest ages 25-34 year old death rate 370.2 in the United States, recent 7 years 2013-2019,  praying in Jesus name that churches get together to support Crawford county childrenuplift family strengthen with bible study, grief support and recovery to prevent the next generation from stepping into the substance mess.

Top 7 Highest SICKENING, Worst CRITICAL ages 25-34 years old Death Rates recent 7 years:

#1 Crawford County, MI ages 25-34 death rate is  248.5 points higher WORSE than U.S. DR 121.7
#2 Iosco County, MI ages 25-34 death rate is 171.9 points higher WORSE than U.S. 
#3 Genesee County, MI  ages 25-34 death rate is 95.2 points higher WORSE than U.S., 
#4 Arenac County, MI death rate is  92.3 points higher WORSE than U.S., 
#5 Ogemaw County, MI ages 25-34 death rate is  81.1 points higher WORSE than U.S., 
#6 Wayne County, MI  ages 25-34 death rate is 79.5 points higher WORSE than U.S.,
#7 Huron County, MI  ages 25-34 death rate is 78.1 points higher WORSE than U.S. - these top 7 worst DR counties are CRITICAL, kids in these counties need EMERGENCY sober protection, godly support, salvation education!  All 48 red light counties are critical, need salvation education, sober protection and support to stop kids from stepping into the substance situation, suffering hard addiction at a young age, as you can see many had tragic unexpected early deaths - HELP parents/kids to church a place that supports sobriety, shine your light, prevent early accidental YOUNG ADULT child deaths!

Top 7 SICKENING, Highest Worst ages 25-34 years old DR (Death Rate) INCREASE counties - comparing recent 7 year DR minus prior 7 years DR:
#1 Crawford County, MI ages 25-34 (death rateincreased 239.6 points recent 7 years! 
#2 Iosco County, MI ages 25-34 (death rateincreased 157.4 points, 
#3 Ogemaw  County, MI  ages 25-34 (death rateincreased 79.7 points, 
#4 Mason County, MI ages 25-34 (death rateincreased 74.4 points,
#5 Huron County, MI ages 25-34 (death rateincreased 70.7 points,
#6 Monroe County, MI ages 25-34 (death rateincreased 62.2 points,
#7 St. Clair County, MI ages 25-34 (death rateincreased 60.5 points - these top 7 worst DR (death rate) INCREASE counties are CRITICAL, kids in these counties need EMERGENCY sober protection, salvation education and support!

Top 7 Highest Worst  ages 25-34 years old Death Increase counties recent 7 years:
#1 Crawford County, MI worst hit hard ages 25-34 years old death increased 200% recent 7 years!
#2 Iosco County, MI ages 25-34 years old death increased 147.4%,
#3 Mason County, MI ages 25-34 years old death increased 85.7%,
#4 Hillsdale County, MI ages 25-34 years old death increased 76.9%,
#5 Emmet County, MI ages 25-34 years old death increased 65.%,
#6 Ingham County, MI ages 25-34 years old death increased 64.9%,
#7 Ogemaw County, MI ages 25-34 years old death increased 64.7% - these top 7 worst DR INCREASE counties are CRITICAL, kids in these counties need EMERGENCY sober protection, salvation education and support!

Immersing the top 7 counties with the most deaths with GODLY supportbreaks dealers' finances.  These 7 counties account for 7,920 deaths ages 25-34 year old in Michigan, 62.8%% of ages 25-34 year old deaths recent 7 years 2013-2019. Godly supportsupports lives of children, creates a heavenly place that educates kids to have no desire for mind-altering substances by telling the truth of Jesus/God's amazing gifts of love, forgiveness, healing, wisdom, faith and strength - gives kids a new Kingdom of God playground dealers can't destroy.
#1 Wayne County, MI, 3,335 deaths ages 25-34 years old recent 7 years 2013-2019!
#2 Oakland County, MI 1,219 deaths ages 25-34 years old recent 7 years 2013-2019!
#3 Macomb County, MI 1,215 deaths ages 25-34 years old recent 7 years 2013-2019!
#4 Genesee County, MI 743 deaths ages 25-34 years old recent 7 years 2013-2019!
#5 Kent County, MI 665 deaths ages 25-34 years old recent 7 years 2013-2019!
#6 Washtenaw County, MI 372 deaths ages 25-34 years old recent 7 years 2013-2019!
#7 Ingham County, MI 371 deaths ages 25-34 years old recent 7 years 2013-2019! - these 7 counties are CRITICAL, kids in these counties need EMERGENCY sober protection, salvation education and support!

Immersing the top 15 counties with the most deaths with GODLY supportbreaks dealers' finances.  These 15 counties account for 9,768 deaths ages 25-34 year old in Michigan, 77.5% of ages 25-34 year old deaths recent 15 years 2013-2019. Godly supportsupports lives of children, creates a heavenly place that educates kids to have no desire for mind-altering substances by telling the truth of Jesus/God's amazing gifts of love, forgiveness, healing, wisdom, faith and strength - gives kids a new Kingdom of God playground dealers can't destroy.
#1 Wayne County, MI, 3,335 deaths ages 25-34 years old recent 7 years 2013-2019!
#2 Oakland County, MI 1,219 deaths ages 25-34 years old recent 7 years 2013-2019!
#3 Macomb County, MI 1,215 deaths ages 25-34 years old recent 7 years 2013-2019!
#4 Genesee County, MI 743 deaths ages 25-34 years old recent 7 years 2013-2019!
#5 Kent County, MI 665 deaths ages 25-34 years old recent 7 years 2013-2019!
#6 Washtenaw County, MI 372 deaths ages 25-34 years old recent 7 years 2013-2019!
#7 Ingham County, MI 371 deaths ages 25-34 years old recent 7 years 2013-2019!
#8 Kalamazoo County, MI 281 deaths ages 25-34 years old recent 7 years 2013-2019!
#9 Saginaw County, MI 249 deaths ages 25-34 years old recent 7 years 2013-2019!
#10 Monroe County, MI 238 deaths ages 25-34 years old recent 7 years 2013-2019!
#11 Muskegon County, MI 237 deaths ages 25-34 years old recent 7 years 2013-2019!
#12 St. Clair County, MI 230 deaths ages 25-34 years old recent 7 years 2013-2019!
#13 Jackson County, MI 224 deaths ages 25-34 years old recent 7 years 2013-2019!
#14 Ottawa County, MI 198 deaths ages 25-34 years old recent 7 years 2013-2019!
#15 Calhoun County, MI 191 deaths ages 25-34 years old recent 7 years 2013-2019! - these 15 counties are CRITICAL, kids in these counties need EMERGENCY sober protection, salvation education and support!

ages 25-34 years old DR (Death Rate) INCREASE/decrease counties - comparing recent 7 year DR minus prior 7 years DR: 

2 counties Sickening Death rate increase of 100+ points ages 25-34 years old recent 7 years:  2 divide that by total county count 72 =2.8%
#1 Crawford County, MI ages 25-34 (death rateincreased 239.6 points recent 7 years! (#13 highest ages 15-24 DR 🠉)
#2 Iosco County, MI ages 25-34 (death rateincreased 157.4 points, 

15 counties Horrific Death rate increase of 40+ points ages 25-34 years old recent 7 years:  15 divide that by total county count 72 =20.8%
#3 Ogemaw  County, MI  ages 25-34 (death rateincreased 79.7 points, (2nd highest ages 15-24 DR 🠉)
#4 Mason County, MI ages 25-34 (death rateincreased 74.4 points, 
#5 Huron County, MI ages 25-34 (death rateincreased 70.7 points, (#11 highest ages 15-24 DR 🠉)
#6 Monroe County, MI ages 25-34 (death rateincreased 62.2 points,
#7 St. Clair County, MI ages 25-34 (death rateincreased 60.5 points,
#8 Genesee County, MI ages 25-34 (death rateincreased 60 points,
#9 Hillsdale County, MI ages 25-34 (death rateincreased 59.6 points,
#10 Jackson County, MI ages 25-34 (death rateincreased  56.1 points, 
#11 Ingham County, MI ages 25-34 (death rateincreased 47.9 points,
#12 Charlevoix County, MI ages 25-34 (death rateincreased 45.2 points,(#14 highest ages 15-24 DR 🠉)
#13 Macomb County, MI ages 25-34 (death rateincreased 43.8 points,#15 highest ages 15-24 DR 🠉)
#14 Sanilac County, MI ages 25-34 (death rateincreased 43.8 points,
#15 Clare County, MI ages 25-34 (death rateincreased 43.2 points,

53 counties Critical ages 25-34 years old Death rate increase recent 7 years:  53 divide that by total county count 72 =73.6%
#16 Manistee County, MI ages 25-34 (death rateincreased 39.3 points(#1 highest ages 15-24 DR 🠉)
#17 Cheboygan County, MI ages 25-34 (death rateincreased 39.2 points,(#7 highest ages 15-24 DR 🠉)
#18 Muskegon County, MI ages 25-34 (death rateincreased 38.2 points,(#5 highest ages 15-24 DR 🠉)
#19 Oceana County, MI DR ages 25-34 (death rateincreased 36.7 points,
#20 Branch County, MI ages 25-34 (death rateincreased 32.7 points,
#21 Washtenaw County, MI ages 25-34 (death rateincreased 31.9 points,
#22 Wayne County, MI DR ages 25-34 (death rateincreased 30.3 points,
#23 Calhoun County, MI DR ages 25-34 (death rateincreased 29.3 points,
#24 Eaton County, MI DR ages 25-34 (death rateincreased 28.1 points,(#8 highest ages 15-24 DR 🠉)
#25 Kalamazoo County, M ages 25-34 (death rateincreased 27.1 points,
#26 St. Joseph County, MI ages 25-34 (death rateincreased 26.5 points,
#27 Tuscola County, MI ages 25-34 (death rateincreased 26.5 points,
#28 Bay County, MI ages 25-34 (death rateincreased 26.3 points,
#29 Livingston County, MI ages 25-34 (death rateincreased 26.1 points,
#30 Chippewa County, MI ages 25-34 (death rateincreased 23.1 points
#31 Ionia County, MI ages 25-34 (death rateincreased 23 points,
#32 Clinton County, MI ages 25-34 (death rateincreased 22.2 points,
#33 Barry County, MI ages 25-34 (death rateincreased 21.9 points,
#34 Charlevoix County, MI ages 25-34 (death rateincreased 21.7 points,
#35 Lenawee County, MI ages 25-34 (death rateincreased 21.5 points, (#12 highest ages 15-24 DR 🠉)
#36 Ottawa County, MI ages 25-34 (death rateincreased 19.8 points,
#37 Marquette County, MI ages 25-34 (death rateincreased 19.2 points,
#38 Oakland County, MI ages 25-34 (death rateincreased 17.4 points,
#39 Kent County, MI ages 25-34 (death rateincreased 16.8 points,
#40 Midland County, MI ages 25-34 (death rateincreased 14.7 points,
#41 Benzie County, MI ages 25-34 (death rateincreased 14.1 points! (3rd highest ages 15-24 DR 🠉)
#42 Cass County, MI ages 25-34 (death rateincreased 13.4 points,(#6 highest ages 15-24 DR 🠉)
#43 Berrien County, MI ages 25-34 (death rateincreased 12.4 points,
#44 Saginaw County, MI ages 25-34 (death rateincreased 9.3 points,
#45 Allegan County, MI ages 25-34 (death rateincreased 8.9 points,
#46 Gladwin County, MI ages 25-34 (death rateincreased 8.3 points, (#10 highest ages 15-24 DR 🠉)
#47 Grand_Traverse County, MI ages 25-34 (death rateincreased 7.6 points,
#48 Gratiot County, MI ages 25-34 (death rateincreased 7.2 points,
#49 Lapeer County, MI ages 25-34 (death rateincreased 7.1 points,
#50 Newaygo County, MI ages 25-34 (death rateincreased 7.1 points,
#51 Kalkaska County, MI ages 25-34 (death rateincreased 5.2 points!
#52 Isabella County, MI ages 25-34 (death rateincreased 3 points,
#53 Antrim County, MI ages 25-34 (death rateincreased 2.6 points,
#54 Roscommon County, MI ages 25-34  DR (death rate) decreased -1.2 points,
#55 Delta County, MI ages 25-34  DR (death rate) decreased -5 points,(#9 highest ages 15-24 DR 🠉)
#56 Dickinson County, MI ages 25-34  DR (death rate) decreased -5.5 points,
#57 Gogebic County, MI ages 25-34  DR (death rate) decreased -7 points,
#58 Otsego County, MI ages 25-34  DR (death rate) decreased -10.2 points,
#59 Osceola County, MI ages 25-34  DR (death rate) decreased -11 points, (4th highest ages 15-24 DR 🠉)
#60 Montcalm County, MI ages 25-34  DR (death rate) decreased -15.2 points,
#61 Alpena County, MI ages 25-34  DR (death rate) decreased -15.4 points!
#62 Houghton County, MI ages 25-34  DR (death rate) decreased -15.6 points,
#63 Menominee County, MI ages 25-34  DR (death rate) decreased -16.1 points,
#64 Shiawassee County, MI ages 25-34  DR (death rate) decreased -19.1 points,
#65 Mecosta County, MI ages 25-34  DR (death rate) decreased -19.2 points,
#66 Wexford County, MI ages 25-34  DR (death rate) decreased -20.9 points,
#67 Van Buren County, MI ages 25-34  DR (death rate) decreased -27.1 points,
#68 Missaukee County, MI ages 25-34  DR (death rate) decreased -55.2 points

Top 7 Best  ages 25-34 years old  DR (Death Rate) DECREASE counties - recent 7 year DR versus prior 7 years DR:
#1 Missaukee County, MI - 8 - 14 years ago (2006-2012) Missaukee had a critical 141.7 death rate, now 7 years later ages 25-34 years old DR (death ratedecreased -55.2 points recent 7 years.  What caused the horrific high ages 25-34 year old deaths in prior years? Did churches, hospitals, schools, AA groups and doctors work together to support young to bring the death rate down?
#2 Best Van Buren County, MI DR (death rate) decreased -27.1 points,
#3 Best Wexford County, MI DR (death rate) decreased -20.9 points,
#4 Best Mecosta County, MI DR (death rate) decreased -19.2 points,
#5 Best Shiawassee County, MI DR (death rate) decreased -19.1 points,
#6 Best Menominee County, MI DR (death rate) decreased -16.1 points,
#7 Best Houghton County, MI DR (death rate) decreased -15.6 points - these top 7 Best DR (death rate) DeCREASE counties are CRITICAL, young parents and kids in these counties continue to need EMERGENCY sober protection

Michigan young adults ages 25-34 years had a 29.7% crude death increase   2013-2019 vs 2006-2012 - - - -  2,886 more crude deaths in the recent 7 Year Span vs prior 7 year3-2019 vs 2006-2012 = 12,611 - 9,725 = 2,886 more crude deaths in the recent 7 Year Span.  Michigan  Ages 25-34 years old had 12,611 crude deaths in the recent 7 years, 2013-2019.

Michigan young adults ages 25-34 years crude death rate increased 26.8 points comparing recent 7 year crude death rate  to prior 7, 2013-2019 vs 2006-2012 death rates = 144.3 - 117.5 = horrific, critical, 26.8 death rate point increase in recent 7 yr period.

Calculation for death increase =  Percent Change = ((New Value - Old Value)/ Old Value )*100 =  29.7% = ((2013-2019 Crude deaths - 2006-2012 Crude deaths ) / (2006-2012 Crude deaths ))*100  = ((12,611 - 9,725) / ( 9,725))*100 = ((2,886)  / ( 9,725))*100  = 29.7% crude death increase for ages 25-34 years old recent 7 years.

2013-2019 Death Rate = Crude Deaths / Population = (12611 / 8739609)*100,000 = 144.3
2006-2012 Death Rate = Crude Deaths / Population = (9725 / 8277605)*100,000 = 117.5
Population % Change = 5.58%
Population Difference = 462,004
Death Rate if Population was same as 2006-2012 = 152.4
Michigan ages 25-34 years old death rate 144.3 is 22.6 points 'higher, WORSE than' U.S. DR 25-34 years old 121.7.

______________________________________

< 1 year old infant Deaths (<1 yr old infant deaths county link)
7 Year Span Comparison 2013-2019
Michigan death rate infants ages < 1 year old is CRITICAL 656.3 is 79.9 points 'higher, WORSE than' U.S. DR < 1 year old 576.4.

24 counties have CRITICAL infant death rates greater than U.S. infant DR 576.4!  Infant is ages < 1 years old.  Deaths not due to covid-19, < deaths prior to covid-19 >
16 counties have CRITICAL  infant DEATH RATE INCREASE recent 7 years DR (death rate) minus prior 7 years DR ! (2013-2019 - 2006-2012) 
9 counties have CRITICAL infant under 1 years old death INCREASE recent 7 years versus 7 years prior!
3 Hot Pink counties have baby deaths ages under 1 years old with deaths of 10 or more recent 7 years 2013-2019 with PRIOR 7 years (2006-2012) sub-national totals with 9 or less deaths, which are not published!
Critical Counties increased 14.3%= ((recent-prior)/prior)*100 = ((24-21)/21)*100 = 14.3% increase in infants ages < 1 year old critical DR counties in Michigan.
counties Horrific infant Death rate increase of 100+ points recent 7 years:  5/53  = 9.4% 
9 counties Critical infant Death rate increase of 40+ points recent 7 years:  9/53 = 17% 
16 counties Sad infant Death rate increase recent 7 years:  16/53 = 30.2% 

3 Hot Pink counties have baby deaths ages under 1 years old with deaths of 10 or more recent 7 years 2013-2019 with PRIOR 7 years (2006-2012) sub-national totals with 9 or less deaths, which are not published.   Sudden, these counties have infant deaths recent 7 years where they didn't show infant deaths prior 7 years - no warning, something new happening adversely affecting parents/children, parents/babies need support!  Many young adults have stepped into substance situation and are suffering hard addiction at a young age - help young parents to church, places that support sobriety, prevent early deaths!
Gladwin County, MI  13 deaths recent 7 years, death rate i182.5 points greater/worse than U.S. ages under 1 years old DR 576.4
Cheboygan County, MI  10 deaths recent 7 years, death rate is 134.8  points greater/worse than U.S. ages under 1 years old DR 576.4
Osceola County, MI 10 deaths recent 7 years, death rate is (18.1) points less/better than U.S. ages under 1 years old DR 576.4
Parents, teens, kids in these counties continue to need EMERGENCY sober protection, salvation education and support!

Educating residents about critical areas and age groups, warns people and save lives.  Reports pinpoints critical areas that need support, churches and families can work together to save lives to prevent future deaths.  When we do not help troubled areas the problem seeps into other age groups and counties.  Wayne county had the highest infant death rate prior seven years (2006-2012) 1,774 infant deaths, Calhoun county had the 2nd highest infant death rate in Michigan prior seven years (2006-2012) 122 infant deaths, Otsego County, MI had the 3rd highest infant death rate in Michigan prior seven years (2006-2012) 18 infant deaths. When we do not help the top worse counties, the problem explodes into neighboring counties.  Horrific substances have entered Michigan, it is deeply affecting young people of parenting age, sad accidents more likely to happen when people are not thinking straight.  Are churches, daycares and schools working to warn parents and uplift family members, support, warn parents/kids?  If residents had known of this critical situation, many infant lives could have been saved in next 7 years  - instead Michigan lost  5,147 infants in the next seven years 2013-2019.  Many young parents are accidently suffering hard addiction due to potency increase illicit substance entering through great lake ports and over-prescribing (medicinal, recreation and vape are over-prescribing).  Are we doing all we can to support young parents?  Are we asking how we can support bringing children to church, supporting churches to help children?  These critical areas need help!

Top 7 Highest Worst  infant (ages < 1 years old) Death Rates recent 7 years:
#1  Iosco County, MI worst  infant (ages < 1 years old) DR death rate critical 368.746 points higher WORSE than U.S. infant DR 576.4! ,
#2 Wayne County, MI 368.704 points higher WORSE than U.S. infant DR 576.4! ,
#3 Saginaw County, MI 275.1 points higher WORSE than U.S. infant DR 576.4! ,
#4 Cass County, MI 242.8 points higher WORSE than U.S. infant DR 576.4! ,
#5 Genesee County, MI 221.7 points higher WORSE than U.S. infant DR 576.4! ,
#6 Branch County, MI 207.4 points higher WORSE than U.S. infant DR 576.4! ,
#7 Gladwin County, MI 182.5 points higher WORSE than U.S. infant DR 576.4  - these top 7 worst DR counties are CRITICAL, kids in these counties need EMERGENCY sober protection, salvation education and support!  All 24 red light counties are critical, salvation education, sober protection and support to stop kids from stepping into the substance situation! Many kids have stepped into substance situation and are suffering hard addiction at a young age - help kids to church, places that support sobriety, prevent early deaths!

Top 7 Highest Worst infant (ages < 1 years old) DR (Death Rate) INCREASE counties - comparing recent DR 7 years minus prior 7 years DR:
#1 worst Branch County, MI (death rate) increased 254.1 points recent 7 years! 
#2 Cass County, MI DR (death rate) increased 251.3 points, 
#3 Shiawassee County, MI DR (death rate) increased 145.5 points, 
#4 Ionia County, MI DR (death rate) increased 132.4 points, 
#5 Delta County, MI DR (death rate) increased 118.6 points, 
#6 Iosco County, MI DR (death rate) increased 99.5 points, 
#7 Clare County, MI DR (death rate) increased 71.9 points - these top 7 worst DR (death rate) INCREASE counties are CRITICAL, kids in these counties need EMERGENCY sober protection, salvation education and support!

Top 7 Highest Worst  ages < 1 years old infant Death Increase counties recent 7 years:
#1 Branch County, MI worst HARDEST HIT ages < 1 years old DEATH INCREASE is Branch County, MI death increased 33.3% recent 7 years! 
#2 Iosco County, MI death increased 25.%, 
#3 Ionia County, MI death increased 25.%, 
#4 Cass County, MI death increased 21.7%, 
#5 Shiawassee County, MI death increased 21.7%, 
#6 Delta County, MI death increased 7.1%, 
#7 Clinton County, MI death increased 5.3% - these top 7 worst DR INCREASE counties are CRITICAL, parents and kids in these counties need EMERGENCY sober protection, salvation education and support!

Top 7 Lowest Best infant DR (Death Rate) DECREASE counties - recent 7 years DR versus prior 7 years DR:
Good Notes:  
 #1 Calhoun County, MI - 8 - 14 years ago (2006-2012) had one of the high infant death rates 1023.5 - now 7 years later ages < 1 years old DR (death rate) decreased -421.5 points recent 7 years. What caused the horrific high Calhoun infant death rate in prior years? Did churches, hospitals and doctors work together to support young Calhoun parents to bring the death rate down?  
#2 Barry County, MI DR (death rate) decreased -415.4 points, 
#3 St. Joseph County, MI DR (death rate) decreased -362.6 points, 
#4 Lenawee County, MI DR (death rate) decreased -280.4 points, 
#5 Otsego County, MI DR (death rate) decreased -268.8 points, 
#6 Gratiot County, MI DR (death rate) decreased -266 points, 
#7 Bay County, MI DR (death rate) decreased -260.3 points - these top 7 Best DR (death rate) DeCREASE counties are CRITICAL, young parents and kids in these counties continue to need EMERGENCY sober protection, salvation education and support!

Top 7 counties with Most  ages < 1 years old Deaths recent 7 years:
Immersing counties with highest ages < 1 years old deaths, with support, breaks dealers' finances.  These 7 counties account for 3,314 deaths in Michigan, 64.4% of deaths recent 7 years 2013-2019!  Educating young parents, teens/kids to have no desire for mind-altering substances by telling the truth while introducing Jesus/God's amazing gifts, love, forgiveness, healing, wisdom, faith and strength - gives kids a new Kingdom of God playground dealers can't destroy.  The 
#1 Wayne County, MI, 1,510 deaths, 
#2 Oakland County, MI 520 deaths, 
#3 Macomb County, MI 382 deaths, 
#4 Kent County, MI 341 deaths, 
#5 Genesee County, MI 265 deaths, 
#6 Ingham County, MI 156 deaths, 
#7 Kalamazoo County, MI 140 deaths - these 7 counties are CRITICAL, kids in these counties need EMERGENCY sober protection, salvation education and support!

Top 15 counties with Most  ages < 1 years old Deaths recent 7 years:
Immersing counties with highest  ages < 1 years old deaths, with support, breaks dealers' finances.  These 15 counties account for 4,093 deaths in Michigan, 79.5% of infant deaths recent 7 years 2013-2019. Educating kids to have no desire for mind-altering substances by telling the truth while introducing Jesus/God's amazing gifts, love, forgiveness, healing, wisdom, faith and strength - gives kids a new Kingdom of God playground dealers can't destroy.  
Wayne County, MI, 1,510 deaths, 
#2 Oakland County, MI 520 deaths, 
#3 Macomb County, MI 382 deaths, 
#4 Kent County, MI 341 deaths, 
#5 Genesee County, MI 265 deaths, 
#6 Ingham County, MI 156 deaths, 
#7 Kalamazoo County, MI 140 deaths 
#8 Washtenaw County, MI 136 deaths, 
#9 Saginaw County, MI 130 deaths, 
#10 Ottawa County, MI 113 deaths, 
#11 Muskegon County, MI 107 deaths, 
#12 Berrien County, MI 88 deaths, 
#13 Jackson County, MI 78 deaths, 
#14 Calhoun County, MI 68 deaths, 
#15 Monroe County, MI 59 deaths - these 15 counties are CRITICAL, kids in these counties need EMERGENCY sober protection, salvation education and support!

5 counties Horrific infant ages < 1 years old Death rate increase of 100+ points recent 7 years:  5 divide that by total county count 53 = 9.4% TOP Priority, Need Most Support!
#1 worst Branch County, MI (death rate) increased 254.1 points recent 7 years! 
#2 Cass County, MI DR (death rate) increased 251.3 points, 
#3 Shiawassee County, MI DR (death rate) increased 145.5 points, 
#4 Ionia County, MI DR (death rate) increased 132.4 points, 
#5 Delta County, MI DR (death rate) increased 118.6 points, 
9 counties Critical infant ages < 1 years old Death rate increase of 40+ points recent 7 years:  9 divide that by total county count 53 = 17% 
#6 Iosco County, MI DR (death rate) increased 99.5 points, 
#7 Clare County, MI DR (death rate) increased 71.9 points, 
#8 Eaton County, MI DR (death rate) increased 48.2 points, 
#9 Oceana County, MI DR (death rate) increased 47.1 points, 
16 counties Sad infant ages < 1 years old Death rate increase recent 7 years:  16 divide that by total county count 53 = 30.2% 
#10 Allegan County, MI DR (death rate) increased 36 points
#11 Isabella County, MI DR (death rate) increased 28.4 points! 
#12 Iosco County, MI DR (death rate) increased 16.8 points, 
#13 Washtenaw County, MI DR (death rate) increased 13.7 points, 
#14 Clinton County, MI DR (death rate) increased 12.6 points, 
#15 Monroe County, MI DR (death rate) increased 7.7 points, 
#16 Ingham County, MI DR (death rate) increased 6.1 points, 
#17 Sanilac County, MI DR (death rate) decreased -0.6 points, 
#18 Hillsdale County, MI DR (death rate) decreased -3.3 points, 
#19 Tuscola County, MI DR (death rate) decreased -5.9 points, 
#20 Montcalm County, MI DR (death rate) decreased -8.1 points
#21 Houghton County, MI DR (death rate)  decreased -9.5 points! 
#22 Muskegon County, MI DR (death rate) decreased  -20 points, 
#23 Macomb County, MI DR (death rate) decreased -24.9 points, 
#24 Jackson County, MI DR (death rate) decreased -29.6 points, 
#25 Van Buren County, MI DR (death rate) decreased -47.1 points, 
#26 Genesee County, MI DR (death rate) decreased -47.9 points, 
#27 Dickinson County, MI DR (death rate) decreased -50 points, 
#28 Grand Traverse County, MI DR (death rate) decreased -54.3 points, 
#29 Chippewa County, MI DR (death rate) decreased -68.5 points, 
#30 Kalamazoo County, MI DR (death rate) decreased -83.6 points
#31 St. Clair County, MI DR (death rate) decreased -86.1 points! 
#32 Oakland County, MI DR (death rate) decreased -91.4 points, 
#33 Lapeer County, MI DR (death rate) decreased -96.7 points, 
#34 Wayne County, MI DR (death rate) decreased -104.8 points, 
#35 Marquette County, MI DR (death rate) decreased -111.3 points, 
#36 Wexford County, MI DR (death rate) decreased -117.6 points, 
#37 Ottawa County, MI DR (death rate) decreased -118.6 points, 
#38 Mecosta County, MI DR (death rate) decreased -119.9 points, 
#39 Newaygo County, MI DR (death rate) decreased -138.6 points, 
#40 Kent County, MI DR (death rate) decreased -165.1 points
#41 Midland County, MI DR (death rate) decreased -176 points!
#42 Berrien County, MI DR (death rate) decreased -189.5 points, 
#43 Livingston County, MI DR (death rate) decreased -191.9 points, 
#44 Bay County, MI DR (death rate) decreased -260.3 points, 
#45 Gratiot County, MI DR (death rate) decreased -266 points, 
#46 Otsego County, MI DR (death rate) decreased -268.8 points, 
#47 Lenawee County, MI DR (death rate) decreased -280.4 points, 
#48 St. Joseph County, MI DR (death rate) decreased -362.6 points, 
#49 Barry County, MI DR (death rate) decreased -415.4 points, 
#50 Calhoun County, MI DR (death rate) decreased -421.5 points

Michigan infants < 1 year olds moved from a critical death rate 83.2 points greater WORSE than U.S. DR 653.4 to a better lower critical death rate 79.9 points greater WORSE than U.S. DR 576.4.  Prior 7 years 8-14 years ago 2006-2012, 21 counties had critical infant DRs (death rates) greater WORSE than U.S.  Without teen substance warnings, sober protection support, sadly the situation exploded into neighboring counties.  Recent 7 years 2013-2019, 24 counties have critical DRs (death rates) higher, WORSE than U.S.  Critical Counties have a DR greater than U.S. DR.  Recent 7 years Michigan Ages < 1 year Critical Counties increased 14.3%= ((recent-prior)/prior)*100 = ((24-21)/21)*100 = 14.3% increase in infants ages < 1 year old critical DR counties in Michigan.

Michigan infants, babies < 1 year had a -15.% crude death decrease   2013-2019 vs 2006-2012 - - - -  -911 less crude deaths in the recent 7 Year Span vs prior 7 years, 2013-2019 vs 2006-2012 = 5,147 - 6,058 = -911 less crude deaths in the recent 7 Year Span.  Michigan  had 5,147  deaths of infants under < 1 years old in the recent 7 years, 2013-2019.  

Michigan death rate ages < 1 year old 656.3 is 79.9 points 'higher, WORSE than' U.S. DR < 1 year old 576.4. 

Michigan babies < 1 year crude death rate decreased -80.3 points comparing recent 7 year crude death rate  to prior 7, 2013-2019 vs 2006-2012 death rates = 656.3 - 736.6 = -80.3 death rate point increase in the recent 7 yr period.

Death Increase/Decrease Calculation = Death Percent Change = ((New Value - Old Value)/ Old Value )*100 =  -15.% =
 ((2013-2019 Crude deaths - 2006-2012 Crude deaths ) / (2006-2012 Crude deaths ))*100  = ((5,147 - 6,058) / ( 6,058))*100 = ((-911)  / ( 6,058))*100  = -15.% crude death increase for ages < 1 year old
2013-2019 Death Rate = Crude Deaths / Population = (5147 / 784255)*100,000 = 656.3
2006-2012 Death Rate = Crude Deaths / Population = (6058 / 822381)*100,000 = 736.6
Population % Change = -4.64%
Population Difference = -38126
Death Rate if Population was same as 2006-2012 = 625.9
______________________________________

7 Year Span Comparison

7 Year Span Comparison 2013-2019
Michigan ages 1-4 years old death rate 25.9 is CRITICAL is 1.4 points higher/WORSE than U.S. DR 1-4 years old DR 24.5.

Michigan ages 1-4 years olds moved from a death rate -2.5 points below U.S. DR 27.8 to a greater WORSE critical death rate 1.4 points greater WORSE than U.S. DR 24.5.  Prior 7 years 8-14 years ago 2006-2012 children in Michigan had an ages 1-4 years old death rate  -2.5 points below U.S. ages 1-4 years old death rate.  Prior 7 years 8-14 years ago 2006-2012, 4 counties had critical DRs (death rates) greater WORSE than U.S. (Berrien, Wayne, Saginaw, Ingham),  without godly community support the critical 4 county DR situation exploded into neighboring counties.  Recent 7 years 2013-2019 13 counties have critical ages 1-4 years old DRs (death rates) higher, WORSE than U.S. DR 24.5.  Critical Counties have a DR greater than U.S. 

High potency substances (crack weed, vape, nicotine, alcohol, xanax, ADHD meds and illicit substances {opiates, meth, cocaine, kratom, etc.} these deceive the person using, prevent people (who could be young parents) from thinking right, parenting well.  So sad, please warn schools, churches, families - keep reaching out inviting people to church, support recovery.

13 counties have CRITICAL ages 1-4 years old death rates greater than U.S. ages 1-4 years old  DR 24.5!  Deaths not due to covid-19, < deaths prior to covid-19 >
7 counties have CRITICAL  ages 1-4 years old DEATH RATE INCREASE recent 7 years DR (death rate) minus prior 7 years DR ! (2013-2019 - 2006-2012) 
7 counties have CRITICAL  ages 1-4 years old death INCREASE recent 7 years versus 7 years prior!  Critical Counties increased 225%= ((recent-prior)/prior)*100 = ((13-4)/4)*100 = 225%  increase  in ages 1-4 years old critical DR counties in Michigan.  7 counties Sad ages 1-4 years old Death rate increase recent 7 years:  7/21 = 33.3% 

6 Hot Pink counties have ages 1-4 years old deaths of 10 or more recent 7 years 2013-2019 with PRIOR 7 years (2006-2012) sub-national totals with 9 or less deaths, which are not published.  All the sudden, these counties have child deaths recent 7 years where they didn't show deaths prior 7 years - no warning!   Branch county not listed in prior 7 year report now has the highest ages 1-4 year old death rate in Michigan!  Young adults of parenting age stepped into horrible substance situation, sadly affecting parent ability to think straight, this is so very sad, suffering unexpected hard addiction at a young age!  Kids and parents need help! 
Branch County, MI  11 deaths recent 7 years, death rate is 47.7 points greater/worse than U.S. ages 1-4 yr old DR 24.5 
Montcalm County, MI  14 deaths recent 7 years, death rate is 44.3 points greater/worse than U.S. ages 1-4 yr old DR 24.5 
Hillsdale County, MI 10 deaths recent 7 years, death rate is 43.8 points greater/worse than U.S. ages 1-4 yr old DR 24.5 
St. Joseph County, MI  15 deaths recent 7 years, death rate is 42.4 points greater/worse than U.S. ages 1-4 yr old DR 24.5 
 Midland County, MI  11deaths recent 7 years, death rate is 19.2 points greater/worse than U.S. ages 1-4 yr old DR 24.5 
Allegan County, MI  10 deaths recent 7 years, death rate is 0.5 points greater/worse than U.S. ages 1-4 yr old DR 24.5 
young parents and kids in these counties continue to need EMERGENCY sober protection, salvation education and support!

Reports Educate and stop seepage:  Why didn't Michigan residents know that Berrien county had the highest ages 1-4 years old death rate prior seven years (2006-2012) 23 child deaths, to support uplift family members, support churches/schools in area to support and warn parents/kids?  Saginaw county had the 2nd highest ages 1-4 year old death rate in Michigan prior seven years (2006-2012) 22 child deathsWayne County, MI had the 3rd highest ages 1-4 year old death rate in Michigan prior 7 years (2006-2012) 216 child deathswhy didn't Michigan residents know so they could help prevent future deaths, uplift family members, support churches/schools in area to help/support/warn parents/kids?  If Michigan residents had known, many child lives might have been saved in next 7 years  - instead Michigan lost 832 children ages 1-4 years old in the next recent 7 years 2013-2019.  Are we asking how we can support bringing children to church, supporting churches to help young parents and children?  


Young parents are accidently suffering hard addiction due to potency increaseillicit substances entering great lake ports and over-prescribing (medicinal, recreation and vape are over-prescribing).  Are churches and schools working to support, warn parents/kids and uplift family members?  Are we asking how we can support bringing people to church, supporting churches to help people?  These critical areas need help!  How do churches support juvenile detention, recovery centers and schools, EMERGENCY sober protection, salvation education and support!  Are we doing all we can to support young parents? Praying report makes its way to people to churches to uplift family members, provide truthful salvation, support warning parents/kids in Jesus name. 

See map, Did prior critical areas get help, did death rate go down in recent 7 years or id the problem seep into neighboring counties?
Berrien county death rate went down slightly, 2 less deaths, but sadly the problem infiltrated to neighboring counties. 

Top 7 Highest Worst ages 1-4 years old Death Rates recent 7 years:
#1 Branch County, MI has worst  ages 1-4 death rate is critical 47.7 points higher WORSE than U.S. ages 1-4 yr old DR 24.5!
#2 Montcalm County, MI ages 1-4 death rate is critical 44.3 points higher WORSE than U.S. ages 1-4 yr old DR 24.5!
#3 Hillsdale County, MI ages 1-4  death rate is critical 43.8 points higher WORSE than U.S. ages 1-4 yr old DR 24.5!
#4 St. Joseph County, MI ages 1-4  death rate is critical 42.4 points higher WORSE than U.S. ages 1-4 yr old DR 24.5! 
#5 Midland County, MI ages 1-4  death rate is critical 19.2 points higher WORSE than U.S. ages 1-4 yr old DR 24.5!
#6 Genesee County, MI ages 1-4  death rate is critical 16.9 points higher WORSE than U.S. ages 1-4 yr old DR 24.5!
#7 Berrien County, MI ages 1-4  death rate is critical 16.2 points higher WORSE than U.S. - these top 7 worst DR counties are CRITICAL, kids in these counties need EMERGENCY sober protection, salvation education and support!  All 13 red light counties are critical, young adults are now parents that stepped into substance situation and are suffering hard addiction at a young age - this is the result, help parents/kids to church a place that supports sobriety, shine your light, prevent early child deaths!  Parents, kids need salvation education, sober protection and support to stop kids from stepping into the substance situation! 

Top 7 Highest Worst ages 1-4 years old DR (Death Rate) INCREASE counties - comparing recent 7 year DR minus prior 7 years DR:
#1 Genesee County, MI HORRIFIC ages 1-4 (death rateincreased 14.1 points recent 7 years! 
#2 Jackson County, MI ages 1-4 DR (death rateincreased 13.9 points, 
#3 St. Clair County, MI ages 1-4 DR (death rateincreased 9.8 points, 
#4 Kalamazoo County, MI ages 1-4 DR (death rateincreased 8.7 points, 
#5 Oakland County, MI ages 1-4 DR (death rateincreased 1.9 points, 
#6 Macomb County, MI ages 1-4 DR (death rateincreased 1.6 points, 
#7 Kent County, MI ages 1-4 DR (death rateincreased 1.4 points - these top 7 worst DR (death rate) INCREASE counties are CRITICAL, kids/PARENTS in these counties need EMERGENCY sober protection, salvation education and support!

Top 7 Highest Worst  ages 1-4 years old Death Increase counties recent 7 years:
#1 Jackson County, MI worst ages 1-4 years old death increased 46.2% recent 7 years! 
#2 Kalamazoo County, MI ages 1-4 years old death increased 36.4%
#3 Genesee County, MI ages 1-4 years old death increased 32.6%
#4 St. Clair County, MI ages 1-4 years old death increased 30.%
#5 Kent County, MI ages 1-4 years old death increased 7.1%
#6 Oakland County, MI ages 1-4 years old death increased 6.3%
#7 Macomb County, MI ages 1-4 years old death increased 3.4% - these top 7 worst DR INCREASE counties are CRITICAL, kids and young parents in these counties need EMERGENCY sober protection, salvation education and support!  Are we askinig how we can support bringing children to church, supporting churches to help children?  Young parents are accidently suffering hard addiction due to potency increase and over-prescribing (medicinal, recreation and vape are over-prescribing the same time illicit substance enter great lake ports (ocean entry via St. Lawrence seaway)  - help kids to church, places that support sobriety, prevent early deaths!   

Immersing the top 7 counties with the most deaths with supportbreaks dealers' finances.  These 7 counties account for 495 child deaths ages 1-4 year old  in Michigan, 59.5% of ages 1-4 year old deaths recent 7 years 2013-2019. Godly support, supports lives of children, creates a heavenly place that educates kids to have no desire for mind-altering substances by telling the truth of Jesus/God's amazing gifts of love, forgiveness, healing, wisdom, faith and strength - gives kids a new Kingdom of God playground dealers can't destroy.  
#1 Wayne County, MI, 198 ages 1-4 years old deaths recent 7 years 2013-2019! 
#2 Oakland County, MI 84 ages 1-4 years old deaths recent 7 years 2013-2019! 
#3 Macomb County, MI 60 ages 1-4 years old deaths recent 7 years 2013-2019! 
#4 Genesee County, MI 57 ages 1-4 years old deaths recent 7 years 2013-2019! 
#5 Kent County, MI 45 ages 1-4 years old deaths recent 7 years 2013-2019! 
#6 Kalamazoo County, MI 30 ages 1-4 years old deaths recent 7 years 2013-2019! 
#7 Berrien County, MI 21 ages 1-4 years old deaths recent 7 years 2013-2019!
 - these 7 counties are CRITICAL, kids in these counties need EMERGENCY sober protection, salvation education and support!

Immersing the top 15 counties, with the most deaths, with supportbreaks dealers' finances.  These 15 counties account for 626 child deaths ages 1-4 year old in Michigan, 75.2% of ages 1-4 year old deaths recent 7 years 2013-2019.  Godly support, supports lives of children, creates a heavenly place that educates kids to have no desire for mind-altering substances by telling the truth of Jesus/God's amazing gifts of love, forgiveness, healing, wisdom, faith and strength - gives kids a new Kingdom of God playground dealers can't destroy.  
#1 Wayne County, MI, 198 ages 1-4 years old deaths recent 7 years 2013-2019! 
#2 Oakland County, MI 84 ages 1-4 years old deaths recent 7 years 2013-2019! 
#3 Macomb County, MI 60 ages 1-4 years old deaths recent 7 years 2013-2019! 
#4 Genesee County, MI 57 ages 1-4 years old deaths recent 7 years 2013-2019! 
#5 Kent County, MI 45 ages 1-4 years old deaths recent 7 years 2013-2019! 
#6 Kalamazoo County, MI 30 ages 1-4 years old deaths recent 7 years 2013-2019! 
#7 Berrien County, MI 21 ages 1-4 years old deaths recent 7 years 2013-2019!
#8 Ingham County, MI 21 ages 1-4 years old deaths recent 7 years 2013-2019!
#9 Jackson County, MI 19 ages 1-4 years old deaths recent 7 years 2013-2019!
#10 Washtenaw County, MI 18 ages 1-4 years old deaths recent 7 years 2013-2019!
#11 Saginaw County, MI 16 ages 1-4 years old deaths recent 7 years 2013-2019!
#12 St. Joseph County, MI 15 ages 1-4 years old deaths recent 7 years 2013-2019!
#13 Ottawa County, MI 15 ages 1-4 years old deaths recent 7 years 2013-2019!
#14 Montcalm County, MI 14 ages 1-4 years old deaths recent 7 years 2013-2019!
#15 St. Clair County, MI 13 ages 1-4 years old deaths recent 7 years 2013-2019!  - these 15 counties are CRITICAL, kids in these counties need EMERGENCY sober protection, salvation education and support!

Top 7 Highest Worst ages 1-4 years old DR (Death Rate) INCREASE counties - comparing recent 7 year DR to prior 7 years DR:
#1 Genesee County, MI ages 1-4 years old death rate increased 14.1 points recent 7 years 2013-2019! 
#2 Jackson County, MI ages 1-4 years old death rate increased 13.9 points recent 7 years 2013-2019! 
#3 St. Clair County, MI ages 1-4 years old death rate increased 9.8 points recent 7 years 2013-2019!  
#4 Kalamazoo County, MI ages 1-4 years old death rate increased 8.7 points recent 7 years 2013-2019! 
#5 Oakland County, MI ages 1-4 years old death rate increased 1.9 points recent 7 years 2013-2019! 
#6 Macomb County, MI ages 1-4 years old death rate increased 1.6 points recent 7 years 2013-2019!  
#7 Kent County, MI ages 1-4 years old death rate increased 1.4 points  recent 7 years 2013-2019!  - these top 7 worst death rate increase counties are CRITICAL, kids in these counties need EMERGENCY sober protection, Godly salvation education and support!

Top 7 Best  ages 1-4 years old death rate decrease counties - recent 7 year DR versus prior 7 years DR:
#1 best  ages 1-4 years old death rate decrease is Ottawa County, MI death rate decreased  -7.7 points. Did churches, hospitals and doctors work together to support young parents to bring the death rate down?  
#2 Washtenaw County, MI death rate decreased  -7.2 points, 
#3 Saginaw County, MI death rate decreased  -6.8 points, 
#4 Ingham County, MI death rate decreased  -5.5 points, 
#5 Muskegon County, MI death rate decreased -1.9 points, 
#6 Berrien County, MI  death rate decreased -1.3 points, 
#7 Wayne County, MI DR death rate decreased -0.8 points 

7 counties Critical ages 1-4  years old Death rate increase recent 7 years:  7 divide that by total county count 21 = 33.3%  
#1 Genesee County, MI ages 1-4 years old death rate increased 14.1 points recent 7 years 2013-2019! 
#2 Jackson County, MI ages 1-4 years old death rate increased 13.9 points recent 7 years 2013-2019! 
#3 St. Clair County, MI ages 1-4 years old death rate increased 9.8 points recent 7 years 2013-2019!  
#4 Kalamazoo County, MI ages 1-4 years old death rate increased 8.7 points recent 7 years 2013-2019! 
#5 Oakland County, MI ages 1-4 years old death rate increased 1.9 points recent 7 years 2013-2019! 
#6 Macomb County, MI ages 1-4 years old death rate increased 1.6 points recent 7 years 2013-2019!  
#7 Kent County, MI ages 1-4 years old death rate increased 1.4 points recent 7 years 2013-2019!
#8 Livingston County, MI ages 1-4 years old death rate decreased 0 points recent 7 years 2013-2019!
#9 Wayne County, MI ages 1-4 years old death rate decreased -0.8 points recent 7 years 2013-2019!
#10 Berrien County, MI ages 1-4 years old death rate decreased -1.3 points recent 7 years 2013-2019!

Michigan children ages 1-4 years had a -3.5% crude death decrease   2013-2019 vs 2006-2012 - - - -  -30 less crude deaths in the recent 7 Year Span vs prior 7 years, 2013-2019 vs 2006-2012 = 832 - 862 = -30 less crude deaths in the recent 7 Year Span.  Michigan  Ages 1-4 years old had 832 crude deaths in the recent 7 years, 2013-2019.

Michigan children ages 1-4 years crude death rate increased .6 points comparing recent 7 year crude death rate  to prior 7, 2013-2019 vs 2006-2012 death rates = 25.9 - 25.3 = .6 death rate point increase in the recent 7 yr period."
Calculation for Percent Change = ((New Value - Old Value)/ Old Value )*100 =  -3.5% =
 ((2013-2019 Crude deaths - 2006-2012 Crude deaths ) / (2006-2012 Crude deaths ))*100  = ((832 - 862) / ( 862))*100 = ((-30)  / ( 862))*100  = -3.5% crude death increase for ages 1-4 years old
2013-2019 Death Rate = Crude Deaths / Population = (832 / 3216891)*100,000 = 25.9
2006-2012 Death Rate = Crude Deaths / Population = (862 / 3412252)*100,000 = 25.3
Population % Change = -5.73%
Population Difference = -195361
Death Rate if Population was same as 2006-2012 = 24.4
Michigan death rate ages 1-4 years old 25.9 is 1.4 points 'higher, WORSE than' U.S. DR 1-4 years old 24.5.
______________________________________

ages 5-14 years old child Deaths (5-14 years old county link)
7 Year Comparison Report, Recent 2013-2019 vs Prior 2006-2012

Michigan ages 5-14 years old death rate 14.7 is 1.5 points higher, WORSE than U.S. ages 5-14 years old DR 13.2.

Michigan children ages 5-14 years old moved from a critical death rate 0.1 points greater WORSE than U.S. ages 5-14 years old DR 13.8 to a critical death rate 1.5 points greater WORSE than U.S. ages 5-14 years old DR 13.2.  Prior 7 years 8-14 years ago 2006-2012, Michigan had an ages 5-14 years old death rate 0.1 points greater than worse than U.S. ages 5-14 years old death rate.

Prior 7 years, 8-14 years ago 2006-2012, counties had critical DRs (death rates) greater WORSE than U.S. (Cass,Saginaw,Genesee,ClintonWayne,Allegan),  

Recent 7 years, 2013-2019, 18 counties have critical DRs (death rates) higher, WORSE than U.S.

Critical Counties increased 200%= ((recent-prior)/prior)*100 = ((18-6)/6)*100 = 200%  increase in ages 5-14 years old critical DR counties in Michigan. Critical Counties have a DR greater than U.S. DR (death rate) 

14 counties have CRITICAL ages 5-14 years old DEATH RATE INCREASE=51.9% of Michigan counties have critical ages 5-14 years old DR increase (14 divided by total county count 27 = 14/27=51.9%
18 counties have CRITICAL ages 5-14 years old death rates greater than U.S. ages 5-14 years old DR 13.2! Deaths not due to covid-19, deaths prior to covid-19
14 counties have CRITICAL ages 5-14 years old DEATH RATE INCREASE recent 7 years DR (death rate) minus prior 7 years DR ! (2013-2019 - 2006-2012) 
10 counties have CRITICAL ages 5-14 years old death INCREASE recent 7 years versus 7 years prior!
6 Hot Pink counties used to be safe 
now have ages 5-14 years old deaths of 10 or more recent 7 years 2013-2019 with PRIOR 7 years (2006-2012) sub-national totals with 9 or less deaths, which are not published!  Suddenly, these counties have child deaths recent 7 years (didn't display child deaths ages 5-14 prior 7 years)no warningCalhoun county not listed in prior 7 year report now has the 2nd highest ages 5-14 year old MI death rate in Michigan
Calhoun County, MI, 28 deaths recent 7 years death rate 9.9 points greater/worse than U.S. ages 5-14 DR 13.2
Tuscola County, MI, 
10 deaths recent 7 years death rate 9.9 points greater/worse than U.S. ages 5-14 DR 13.2
* St. Joseph County, MI, 13 deaths recent 7 years death rate 8.6 points greater/worse than U.S. ages 5-14 DR 13.2 * Shiawassee County, MI, 12 deaths recent 7 years death rate 7.4 points greater/worse than U.S. ages 5-14 DR 13.2 * Van Buren County, MI, 13 deaths recent 7 years death rate 5.3 points greater/worse than U.S. ages 5-14 DR 13.2 Grand Traverse County, MI, 10 deaths recent 7 years death rate 0.2 points greater/worse than U.S. ages 5-14 DR 13.2 - kids in these counties need godly Jesus support, EMERGENCY sober protection!

Why didn't Michigan residents know SAGINAW county had highest ages 5-14 death rate prior seven years ((2006-2012) 43 young deaths) to support uplift family members, support churches/schools to support, warn parents/kids? CASS county had 2nd highest ages 5-14 death rate in Michigan prior seven years 2006-2012, 11 deaths ages 15-24 years old, ALLEGAN County, MI had 3rd highest ages 5-14 death rate in Michigan prior 7 years, 2006-2012, 23 young deathswhy wasn't this presented to Michigan residents to learn from the situations, to uplift family members, support churches/schools in area to support, warn parents/kids? If Michigan had known, many young lives might have been saved 2013-2019 - instead Michigan lost 1,260 young children ages 5-14 in the next seven years 2013-2019.  Many parents are accidently suffering hard addiction  due to potency increase and over-prescribing.   Are we doing all we can to support bringing kids and people to church, supporting churches to help people, bring gospel to prisons? Praying this report makes its way to people, to churches to uplift family members, provide truthful support warning parents/kids in Jesus name.
  
See map, Did prior critical areas get help? Did death rate go down recent 7 years or did problem seep into neighboring counties?SAGINAW situation did not get enough coverage, sadly 😭problem seeped to Tuscola,Shiawassee and Livingston .CASS situation exploded, seeped into Van Buren,St. JosephCalhounEaton and Ingham! Did Grand_Traverse geta bad shipment, DR went up, drugs entering Michigan through ocean great lake ports via St. Lawrence seaway - see "facebook deceiving mind altering substances to see posts of shipments caught, it is obvious some shipments made it through undetected -kids need warning and increased sobriety protection.

Top 7 Highest Worst ages 5-14 years old Death Rates recent 7 years:
#1 Cass County ages 5-14 years old DR death rate critical 21.0 points higher WORSE than U.S. DR 13.2!
#2 
Calhoun County, MI ages 5-14 years old death rate critical 9.9 points higher WORSE than U.S.
#3 
Tuscola County, MI ages 5-14 years old death rate critical 9.9 points higher WORSE than U.S.,
#4 
St. Joseph County, MI ages 5-14 years old death rate critical 8.6 points higher WORSE than U.S.,
#5 
Saginaw County, MI ages 5-14 years old death rate critical 8.4 points higher WORSE than U.S.,
#6 
Shiawassee County, MI ages 5-14 years old death rate critical 7.4 points higher WORSE than U.S.,
#7 
Eaton County, MI ages 5-14 years old death rate critical 6.6 points higher WORSE than U.S. - these top 7 worst DR counties are CRITICAL, kids in these counties need EMERGENCY sober protection, salvation education and support!   All 18 red light counties are critical, kids in these counties need Jesus/Godly sober protection and salvation support to stop kids from stepping into the substance situation! Many kids stepped into substance situation and are suffering hard addiction at a young age - help kids to church, places that support sobriety, prevent early deaths!
Top 7 Highest Worst ages 5-14 years old DR (Death Rate) INCREASE counties - comparing recent 7 year DR minus prior 7 years DR: 
#1 Cass ages 5-14 years old death rate increased 11.8 points recent 7 years!
#2 Eaton County, MI ages 5-14 years old death rate increased 8.9 points,
#3 Ottawa County, MI ages 5-14 years old death rate increased 4.4 points,
#4 Ingham County, MI ages 5-14 years old death rate increased 4 points,
#5 Monroe County, MI ages 5-14 years old death rate increased 2.9 points,
#6 Macomb County, MI ages 5-14 years old death rate increased 2.9 points,
#7 Livingston County, MI ages 5-14 years old death rate increased 2.4 points - these top 7 worst DR death rate increase counties are critical, kids in these counties need Jesus/Godly EMERGENCY sober protection, education and support!

#8 
Muskegon County, MI ages 5-14 years old DR increased 1.8 points,
#9 Jackson County, MI ages 5-14 years old DR increased 1.8 points
#10 Lenawee County, MI ages 5-14 years old DR increased 1.6 points,
#11 Genesee County, MI ages 5-14 years old death rate increased 1.5 points,
#12 Kalamazoo County, MI ages 5-14 years old death rate increased 1.2 points,
#13 Berrien County, MI ages 5-14 years old death rate increased 1 points,
#14 St. Clair County, MI ages 5-14 years old death rate increased 0.8 points,
#15 Clinton County, MI ages 5-14 years old DR decreased -0.3 points,
#16 Wayne County, MI ages 5-14 years old DR decreased -0.4 points,
#17 Kent County, MI ages 5-14 years old DR decreased -0.5 points,
#18 Washtenaw County, MI ages 5-14 years old DR decreased -1 points,
#19 Oakland County, MI ages 5-14 years old DR decreased -1.3 points,
#20 Saginaw County, MI ages 5-14 years old DR decreased -1.4 points,
#21 Allegan County, MI ages 5-14 years old DR decreased -6.5 points (what happened in Allegan county that caused high death rate increase in prior 7 years 2006-2012?) Did residents know of this situation, uplift family members, support churches/schools in area to help/support/warn parents/kids?

Top 7 Highest Worst ages 
5-14 years old
 Death Increase  counties recent 7 years:
#1 Eaton County, MI HARDEST HIT ages 5-14 years old death increased 63.6% recent 7 years! 
#2 Ottawa County, MI ages 5-14 years old death increased 38.7%,
#3 Cass County, MI ages 5-14 years old death increased 36.4%,
#4 Ingham County, MI ages 5-14 years old death increased 25.8%,
#5 Macomb County, MI ages 5-14 years old death increased 21.3%,
#6 Monroe County, MI ages 5-14 years old death increased 14.3%,
#7 Kalamazoo County, MI ages 5-14 years old death increased12.% - these top 7 worst death INCREASE counties are CRITICAL, kids in these counties need EMERGENCY godly, sober protection and support! 

Giving the top 7 counties with the most ages 5-14 years old deaths, support, giving these counties godly supportbreaks dealers' finances. These 7 counties account for 694 child deaths ages 5-14 years old in Michigan, 55.1% of deaths ages 5-14 years old recent 7 years 2013-2019. Godly support, supports lives of children, creates a heavenly place that educates kids to have no desire for mind-altering substances by telling the truth of Jesus/God's amazing gifts of love, forgiveness, healing, wisdom, faith and strength - gives kids a new Kingdom of God playground dealers can't destroy. 
#1 Wayne County, MI, 274 ages 5-14 years old child deaths recent 7 years 2013-2019,
#2 
Oakland County, MI 100 
ages 5-14 years old child deaths recent 7 years 2013-2019,
#3 Macomb County, MI 97 ages 5-14 years old child deaths recent 7 years 2013-2019,
#4 Kent County, MI 75 ages 5-14 years old child deaths recent 7 years 2013-2019,
#5 
Genesee County, MI
 66 ages 5-14 years old child deaths recent 7 years 2013-2019,
#6 Ottawa County, MI 43 ages 5-14 years old child deaths recent 7 years 2013-2019,
#7 Ingham County, MI39 ages 5-14 years old child deaths recent 7 years 2013-2019- these 7 counties are CRITICAL, kids in these counties need EMERGENCY Godly, sober protection and support!

Giving the top 15 counties with the most ages 5-14 years old deaths, support, giving these 15 counties godly support,breaks dealers' finances. These 15 counties account for 894 child deaths ages 5-14 years old in Michigan, 71% of deaths ages 5-14 years old recent 7 years 2013-2019. Godly support, supports lives of children, creates a heavenly place that educates kids to have no desire for mind-altering substances by telling the truth of Jesus/God's amazing gifts of love, forgiveness , healing, wisdom, faith and strength - ;gives kids a new Kingdom of God playground dealerscan't destroy.
#1 Wayne County, MI, 274ages 5-14 years oldchild deaths recent 7 years 2013-2019,
#2 
Oakland County, MI 100 
ages 5-14 years old child deaths recent 7 years 2013-2019,
#3 Macomb County, MI97 ages 5-14 years old child deaths recent 7 years 2013-2019,
#4 
Kent County, MI 75ages 5-14 years old child deaths recent 7 years 2013-2019,
#5 Genesee County, MI 66 ages 5-14 years old child deaths recent 7 years 2013-2019,
#6 Ottawa County, MI 43 ages 5-14 years old child deaths recent 7 years 2013-2019,
#7 Ingham County, MI 39 ages 5-14 years old child deaths recent 7 years 2013-2019
#8 Saginaw County, MI 35 ages 5-14 years old child deaths recent 7 years 2013-2019, #9 Washtenaw County, MI 30 ages 5-14 years old child death recent 7 years 2013-2019,
#10 
Calhoun  County, MI 28 ages 5-14 years old child deaths recent 7 years 2013-2019, #11 Kalamazoo County, MI 28 ages 5-14 
years old child deaths recent 7 years 2013-2019,
#12 
Livingston  County, MI 21 ages 5-14 years old child deaths recent 7 years 2013-2019,
#13 
Muskegon County, MI 21 ages 5-14 years old child deaths recent 7 years 2013-2019,
#14 
Berrien County, MI 19 ages 5-14 years old child deaths recent 7 years 2013-2019,
#15 Eaton County, MI 18 ages 5-14 years old child deaths recent 7 years 2013-2019 - these 15 counties are CRITICAL, kids in these counties need Jesus/Godly EMERGENCY sober protection and support!

Top 7 Best
 ages 5-14 years old DR (Death Rate) DECREASE counties - recent 7 year DR versus prior 7 years DR: 
#1 best ages 5-14 years old DEATH RATE DeCREASE is # 21Allegan County, MI - 8 - 14 years ago (2006-2012) Allegan had one of the highest worst 19.8 death rates, now 7 years later ages 5-14 years old DR (death rate) decreased -6.5 points recent 7 years. What caused the horrific high ages 5-14 years old deaths in Allegan in prior years? Did churches, hospitals and doctors work together to support young parents to bring the death rate down?
#2 Best Saginaw County, MI DR decreased -1.4 points,
#3 Best Oakland County, MI DR decreased -1.3 points,
#4 Best Washtenaw County, MI DR decreased -1 points,
#5 Best Kent County, MI DR decreased -0.5 points,
#6 Best 
Wayne County, MI DR decreased -0.4 points,
#7 Best Clinton County, MI DR decreased -0.3 points
Michigan children ages 5-14 years had a -2.7% crude death decrease 2013-2019 vs 2006-2012 - - - - -35 less crude deaths recent 7 years vs prior 7 years, 2013-2019 vs 2006-2012 = 1,260 - 1,295 = -35 less deaths recent 7 years. Michigan Ages 5-14 years old had 1,260 deaths recent 7 years, 2013-2019.
Michigan children ages 5-14 years crude death rate increased 0.8 points comparing recent 7 year death rate to prior 7 year DR, 2013-2019 vs 2006-2012 death rates = 14.7 - 13.9 = 0.8 death rate point increase recent 7 yr period.

Death Increase/Decrease Calculation = 
Death percent Change = ((New Value - Old Value)/ Old Value )*100 =  -2.7% = ((Recent_deaths - Prior_deaths ) / (Prior_deaths ))*100  = ((1,260 - 1,295) / ( 1,295))*100 = ((-35)  / ( 1,295))*100  = -2.7% crude death increase for ages 5-14 years old
2013-2019 Death Rate = Crude Deaths / Population = (1260 / 8578621)*100,000 = 14.7
2006-2012 Death Rate = Crude Deaths / Population = (1295 / 9332722)*100,000 = 13.9  =
Population % Change = -8.08%
Population Difference = -754101
Death Rate if Population was same as 2006-2012 = 13.5

Michigan death rate ages 5-14 years old14.7is 1.5 points 'higher, WORSE than' U.S. DR 5-14 years old 13.2CRITICAL! 
______________________________________

35-44 years old Deaths (35-44 years old county link)

7 Year Span Comparison 2013-2019
Michigan ages 35-44 years old is criticaldeath rate  211.8 is 24.8 points 'higher, WORSE than' U.S. DR 35-44 years old 187.

Michigan ages 35-44 years old moved from a critical death rate 12.9 points greater WORSE than U.S. DR 179.1 to a critical death rate 24.8 points greater WORSE than U.S. DR 187!!!  Prior 7 years, 8-14 years ago, 2006-2012, Michigan had an ages 35-44 years old death rate 12.9 points greater than worse than U.S. ages 35-44 years old death rate.  
  • Prior 7 years, 8-14 years ago, 2006-2012, 46 counties had critical DRs (death rates) greater WORSE than U.S. ,  
  • Recent 7 years 2013-2019 52 counties have critical DRs (death rates) higher, WORSE than U.S.  
  • Critical Counties have a DR greater than U.S. DR. 
  • Michigan Ages 35-44 years Critical Counties increased 13%= ((recent-prior)/prior)*100 = ((52-46)/46)*100 = 13%  increase  in ages 35-44 years old critical DR counties in Michigan.
Michigan ages 35-44 years old had a -2.% death decrease   2013-2019 vs 2006-2012 - - - -  -360 less crude deaths in the recent 7 Year Span vs prior 7 years, 2013-2019 vs 2006-2012 = 17,392 - 17,752 = -360 less crude deaths in the recent 7 Year Span.  Michigan  ages 35-44 years old had 17,392 deaths in the recent 7 years, 2013-2019.

Michigan ages 35-44 years old death rate increased 19.9 points (critical increase) comparing recent 7 year death rate to prior 7, 2013-2019 vs 2006-2012 death rates = 211.8 - 191.9 = 19.9 death rate point increase in the recent 7 yr period.

52 counties have CRITICAL ages 35-44 years old death rates greater/worse than U.S. ages 35-44 years old  DR 187!  Deaths not due to covid-19, < deaths prior to covid-19 >
54 counties have CRITICAL ages 35-44 years old DEATH RATE INCREASE recent 7 years DR (death rate) minus prior 7 years DR ! (2013-2019 - 2006-2012) 54 divide that by total county count 79 = 68.4% 
37 counties have CRITICAL ages 35-44 years old death INCREASE recent 7 years versus 7 years prior!
Critical Counties increased 13%= ((recent-prior)/prior)*100 = ((52-46)/46)*100 = 13%  increase in ages 35-44 years old critical DR counties in Michigan.
2 counties had ages 35-44 years old Death rate increase of 100+ points recent 7 yrs:  2 divided by total county count 79 =2.5% (Sickening DR 🠉) (Otsego & Gogebic)
27 counties had ages 35-44 years old Death rate increase of 40+ points recent 7 years:  27 divide by total county count 79 =34.2% (Horrific DR 🠉)

1 Hot Pink county used to be safe, now has ages 35-44 years old deaths of 10 or more recent 7 years 2013-2019 with PRIOR 7 years sub-national totals with 9 or less deaths, which are not published.  All the sudden, this county has young adult deaths recent 7 years where it didn't display deaths prior 7 years 2006-2012 - no warning!   Suddenly, Baraga county has ages 35-44 deaths recent 7 years (didn't display deaths ages 35-44 prior 7 years)no warningBaraga county not listed in prior 7 year report now has the 67th highest ages 35-44 year old MI death rate in Michigan
Baraga County, MI, 11 deaths recent 7 years, death rate (32.5) points lower/better than U.S. ages 35-44 DR 187.0

Top 7 Highest Worst  ages 35-44 years old Death Rates recent 7 years:
#1 Oscoda worst ages 35-44 years old DR death rate is critical 162.69 points higher WORSE than U.S. DR 187! 
#2 Otsego County, MI ages 35-44 death rate is critical 155.4 points higher WORSE than U.S. DR 187! 
#3 Montmorency County, MI ages 35-44 death rate is critical 123.1 points higher WORSE than U.S. DR 187! 
#4 Roscommon County, MI ages 35-44 death rate is critical 122.6 points higher WORSE than U.S. DR 187! 
#5 Wayne County, MI ages 35-44 death rate is critical 119.9 points higher WORSE than U.S. DR 187! 
#6 Clare County, MI ages 35-44 death rate is critical 114 points higher WORSE than U.S. DR 187! 
#7 Genesee County, MI ages 35-44 death rate is critical 105.7 points higher WORSE than U.S. DR 187!  - these top 7 worst DR counties are CRITICAL, kids in these counties need EMERGENCY sober protection, salvation education and support!  All 52 red light counties are critical, need life education, sober protection and support to prevent the next generation of kids from stepping into the substance situation

Many stepped into sickening substance situation and are suffering hard addiction at a young age.  We can help by supporting church recovery,  support services and bible study for juvenile detention, support services for recovery centers, prisons.

Top 7 Highest Worst ages 35-44 years old DR (Death Rate) INCREASE counties - comparing recent DR 7 years minus prior 7 years DR:
#1 Otsego worst  HORRIFIC ages 35-44 years old death rate increased 156.6 points recent 7 years 2013-2019! 
#2 Gogebic County, MI ages 35-44 HORRIFIC death rate increased 101.4 points, 
#3 Oscoda County, MI ages 35-44 HORRIFIC death rate increased 86.2 points, 
#4 Mackinac County, MI ages 35-44 death rate increased 81.1 points, 
#5 Calhoun County, MI ages 35-44death rate increased 69 points, 
#6 Kalkaska County, MI ages 35-44 death rate increased 68 points, 
#7 Mason County, MI ages 35-44 death rate increased 66.2 points - these top 7 worst  ages 35-44 death rate increase counties are CRITICAL, need EMERGENCY Godly Jesus sober protection, life education and support!

Top 7 Highest Worst  ages 35-44 years old Death Increase counties recent 7 years:
#1 Gogebic HARDEST HIT ages 35-44 years old death increased 60% recent 7 years! 
#2 Otsego County, MI ages 35-44 death increased 51.2%
#3 Kalkaska County, MI ages 35-44 death increased 25.%
#4 Mason County, MI ages 35-44 death increased 24.4%
#5 Delta County, MI ages 35-44 death increased 21.4%
#6 Missaukee County, MI ages 35-44 death increased 20%
#7 Calhoun County, MI ages 35-44 death increased 18.7% - these top 7 worst DR INCREASE counties are CRITICAL, kids in these counties need EMERGENCY sober protection, salvation education and support!

Giving the top 7 counties with the most ages 35-44 years old deaths, support, giving these counties godly supportbreaks dealers' finances. These 7 counties account for 10,540 deaths ages 35-44 years old in Michigan, 60.6% of deaths ages 35-44 years old recent 7 years 2013-2019. Godly support, supports lives of children, creates a heavenly place that educates kids to have no desire for mind-altering substances by telling the truth of Jesus/God's amazing gifts of love, forgiveness, healing, wisdom, faith and strength - gives kids a new Kingdom of God playground dealers can't destroy. 
#1 Wayne, MI, 4,568 ages 35-44 years old deaths recent 7 years 2013-2019,
#2 Oakland County, MI 1,707 years old deaths recent 7 years 2013-2019,
#3 Macomb County, MI 1,582 years old deaths recent 7 years 2013-2019,
#4 Genesee County, MI 998 years old deaths recent 7 years 2013-2019,
#5 Kent County, MI 827 years old deaths recent 7 years 2013-2019,
#6 Ingham County, MI 450 years old deaths recent 7 years 2013-2019,
#7 Washtenaw County, MI 408 years old deaths recent 7 years 2013-2019 - these 7 counties are CRITICAL, counties need EMERGENCY Godly sober protection, life education and support!

Giving the top 15 counties with the most ages 35-44 years old deaths, support, giving these counties godly supportbreaks dealers' finances. These 15 counties account for 13,125 deaths ages 35-44 years old in Michigan, 75.5% of deaths ages 35-44 years old recent 7 years 2013-2019. Godly support, supports lives of children, creates a heavenly place that educates kids to have no desire for mind-altering substances by telling the truth of Jesus/God's amazing gifts of love, forgiveness, healing, wisdom, faith and strength - gives kids a new Kingdom of God playground dealers can't destroy. 
#1 Wayne, MI, 4,568 ages 35-44 years old deaths recent 7 years 2013-2019,
#2 Oakland County, MI 1,707 years old deaths recent 7 years 2013-2019,
#3 Macomb County, MI 1,582 years old deaths recent 7 years 2013-2019,
#4 Genesee County, MI 998 years old deaths recent 7 years 2013-2019,
#5 Kent County, MI 827 years old deaths recent 7 years 2013-2019,
#6 Ingham County, MI 450 years old deaths recent 7 years 2013-2019,
#7 Washtenaw County, MI 408 years old deaths recent 7 years 2013-2019
#8 Kalamazoo County, MI 381 years old deaths recent 7 years 2013-2019,
#9 Muskegon County, MI 364 years old deaths recent 7 years 2013-2019,
#10 Saginaw County, MI 356 years old deaths recent 7 years 2013-2019,
#11 Calhoun County, MI 317 years old deaths recent 7 years 2013-2019,
#12 Monroe County, MI 298 years old deaths recent 7 years 2013-2019,
#13 Jackson County, MI 295 years old deaths recent 7 years 2013-2019,
#14 St. Clair County, MI 290 years old deaths recent 7 years 2013-2019,
#15 Berrien County, MI 284 years old deaths recent 7 years 2013-2019 - these 15 counties are CRITICAL, kids in these counties need EMERGENCY sober protection, salvation education and support!

Education Stop Seepage:  Prior 7 year critical areas without support not only gets worse, the situation spreads to other areas.  Arenac County, MI had the highest ages 35-44 years old death rate prior 7 years (2006-2012) 40 ages 35-44 years old  deaths, Iosco, County, MI had the 2nd highest  ages 35-44 years old death rate in Michigan prior 7 years (2006-2012) 57 ages 35-44 years old  deaths, Lake County, MI had the 3rd highest  ages  ages 35-44 years old  death rate in Michigan prior 7 years (2006-2012) 26 ages 35-44 years old deaths.  why wasn't this presented to Michigan residents to learn from the situations, to uplift family members, support churches/schools in area to support, warn parents/kids? If Michigan had known, many young lives might have been saved 2013-2019 - instead Michigan lost  17,392 young people ages 35-44 years old  in the next 7 years 2013-2019.  Sadly due to very little education, this situation exploded into neighboring counties in recent 7 years. Many parents are accidently suffering hard addiction  due to potency increase and over-prescribing.   Are we doing all we can to support bringing kids and people to church, supporting churches to help people, bring gospel to prisons? Praying this report makes its way to people, to churches to uplift family members, provide truthful support warning parents/kids in Jesus name.

2 counties critical ages 35-44 years old Death rate increase of 100+ points recent 7 yrs:  2 divided by total county count 79 =2.5% (Sickening DR 🠉) (Otsego & Gogebic)
#1 Otsego County, MI ages 35-44 death rate increased 156.6 points recent 7 years! 
#2 Gogebic County, MI ages 35-44 death rate increased 101.4 points, 

27 counties critical ages 35-44 years old Death rate increase of 40+ points recent 7 years:  27 divide by total county count 79 =34.2(Horrific DR 🠉)
#3 Oscoda County, MI ages 35-44 death rate increased 86.2 points, 
#4 Mackinac County, MI ages 35-44 death rate increased 81.1 points, 
#5 Calhoun County, MI ages 35-44 death rate increased 69 points, 
#6 Kalkaska County, MI ages 35-44 death rate increased 68 points, 
#7 Mason County, MI DR ages 35-44 death rate increased 66.2 points, 
#8 Missaukee County, MI ages 35-44 death rate increased 63.9 points, 
#9 Sanilac County, MI ages 35-44 death rate increased 58.3 points, 
#10 Montmorency County, MI ages 35-44 death rate increased 56.6 points,
#11 Hillsdale County, MI ages 35-44 death rate increased 53 points! 
#12 Huron County, MI ages 35-44 death rate increased 51.6 points, 
#13 Branch County, MI ages 35-44 death rate increased 51.3 points, 
#14 Monroe County, MI ages 35-44 death rate increased 49.8 points, 
#15 Delta County, MI ages 35-44 death rate increased 49.4 points, 
#16 Lenawee County, MI ages 35-44 death rate increased 49.2 points, 
#17 Muskegon County, MI ages 35-44 death rate increased 48.6 points, 
#18 Lapeer County, MI ages 35-44 death rate increased 48.5 points, 
#19 Presque_Isle County, MI ages 35-44 death rate increased 48.1 points, 
#20 Huron County, MI ages 35-44 death rate increased 47.8 points,
#21 Iron County, MI ages 35-44 death rate increased 47.4 points! 
#22 Bay County, MI ages 35-44 death rate increased 45.7 points, 
#23 Montcalm County, MI ages 35-44 death rate increased 45.6 points, 
#24 Wexford County, MI ages 35-44 death rate increased 42.5 points, 
#25 Genesee County, MI ages 35-44 death rate increased 42.1 points, 
#26 Livingston County, MI ages 35-44 death rate increased  41.9 points, 
#27 Berrien County, MI ages 35-44 death rate increased 40.9 points, 

54 counties have CRITICAL ages 35-44 years old DEATH RATE INCREASE recent 7 years (2013-2019 vs  2006-2012) 
#28 Eaton County, MI ages 35-44 death rate increased 39.8 points, 
#29 Jackson County, MI ages 35-44 death rate increased 37.5 points, 
#30 Cass County, MI ages 35-44 death rate increased 36.6 points,
#31 Macomb County, MI ages 35-44 death rate increased 35.1 points! 
#32 Roscommon County, MI ages 35-44 death rate increased 35 points, 
#33 Ogemaw County, MI ages 35-44 death rate increased 33.7 points, 
#34 Alger County, MI ages 35-44 death rate increased 30.1 points, 
#35 Clare County, MI ages 35-44 death rate increased 29 points, 
#36 Mecosta County, MI ages 35-44 death rate increased 28 points, 
#37 Oceana County, MI ages 35-44 death rate increased 26.7 points, 
#38 Wayne County, MI ages 35-44 death rate increased 25.9 points, 
#39 Grand_Traverse County, MI ages 35-44 death rate increased 25.6 points, 
#40 Menominee County, MI ages 35-44 death rate increased 25.4 points,
#41 Gratiot County, MI ages 35-44 death rate increased 22.2 points! 
#42 Ingham County, MI ages 35-44 death rate increased 21.1 points, 
#43 Allegan County, MI ages 35-44 death rate increased 20.4 points, 
#44 Clinton County, MI ages 35-44 death rate increased 19.3 points, 
#45 Charlevoix County, MI ages 35-44 death rate increased 17.3 points, 
#46 St. Clair County, MI ages 35-44 death rate increased 13.7 points, 
#47 Crawford County, MI ages 35-44 death rate increased 13.2 points, 
#48 Washtenaw County, MI ages 35-44 death rate increased 10.8 points, 
#49 Oakland County, MI ages 35-44 death rate increased 10.4 points, 
#50 Alcona County, MI ages 35-44 death rate increased 9.2 points,
#51 Kent County, MI ages 35-44 death rate increased 7.8 points! 
#52 Benzie County, MI ages 35-44 death rate increased 6.6 points, 
#53 Isabella County, MI ages 35-44 death rate increased 2.2 points, 
#54 Barry County, MI ages 35-44 death rate increased 0.7 points, 
#55 Kalamazoo County, MI DR (death rate) decreased -0.5 points, 
#56 Emmet County, MI DR (death rate) decreased -0.7 points, 
#57 Alpena County, MI DR (death rate) decreased -1.5 points, 
#58 Midland County, MI DR (death rate) decreased -1.6 points, 
#59 Ionia County, MI DR (death rate) decreased -3.3 points, 
#60 Ottawa County, MI DR (death rate) decreased -3.4 points,
#61 Manistee County, MI DR (death rate) decreased -3.6 points! 
#62 Saginaw County, MI DR (death rate) decreased -4.8 points, 
#63 Shiawassee County, MI DR (death rate) decreased -6 points, 
#64 Van Buren County, MI DR (death rate) decreased -6.7 points, 
#65 Antrim County, MI DR (death rate) decreased -8.8 points, 
#66 Cheboygan County, MI DR (death rate) decreased -10.9 points, 
#67 Iosco County, MI DR (death rate) decreased -12.6 points, 
#68 Dickinson County, MI DR (death rate) decreased -14.9 points, 
#69 Leelanau County, MI DR (death rate) decreased -16.2 points, 
#70 St. Joseph County, MI DR (death rate) decreased -17.4 points,
#71 Marquette County, MI DR (death rate) decreased -25.1 points! 
#72 Newaygo County, MI DR (death rate) decreased -25.3 points, 
#73 Gladwin County, MI DR (death rate) decreased -33.3 points, 
#74 Houghton County, MI DR (death rate) decreased -33.8 points, 
#75 Osceola County, MI DR (death rate) decreased -35.5 points, 
#76 Lake County, MI DR (death rate) decreased -36.2 points, 
#77 Chippewa County, MI DR (death rate) decreased -56.2 points, 
#78 Arenac County, MI DR (death rate) decreased -77 points
correct

Top 7 Best  ages 35-44 years old  DR (Death Rate) DECREASE counties - recent 7 year DR versus prior 7 years DR:
#1 best  ages 35-44 years old DEATH RATE DeCREASE  is 
# 78 Arenac County, MI - 8 - 14 years ago (2006-2012) Arenac had one of the highest worst 311.1 death rates, now 7 years later ages 35-44 years old DR (death rate) decreased -77 points recent 7 years, which is very good.  What caused the horrific high ages 35-44 years old  deaths in prior years? Did churches, hospitals and doctors work together to support young parents to bring the death rate down?  Four of the top seven death rate decreases are critical death rate counties, meaning they had horrific death rates 8-14 years ago 2006-2012.   Two death rate decrease counties Marquette and Houghton were critical counties 8-14 years ago 2006-2012 and would still be critical if they hadn't had death rate decrease in recent 7 years 2013-2019.  
#2 Best DR decrease  Chippewa County, MI DR (death rate) decreased -56.2 points, 
#3 Best DR decrease Lake County, MI DR (death rate) decreased -36.2 points, 
#4 Best DR decrease Osceola County, MI DR (death rate) decreased -35.5 points, 
#5 Best DR decrease Houghton County, MI DR (death rate) decreased -33.8 points, 
#6 Best DR decrease Gladwin County, MI DR (death rate) decreased -33.3 points, 
#7 Best DR decrease Newaygo County, MI DR (death rate) decreased -25.3 points - these counties continue to need support to move to green death rates, under U.S. death rate.

Calculation for death increase is percent change = ((NewValue - OldValue) / OldValue)*100 =  -2.% =((2013-2019deaths - 2006-2012deaths ) / (2006-2012deaths ))*100  = ((17,392 - 17,752) / ( 17,752))*100 = ((-360)  / ( 17,752))*100  = -2.% crude death increase for ages 35-44 years old
2013-2019 Death Rate = Deaths / Population = (17,392 / 8,209,640)*100,000 = 211.8
2006-2012 Death Rate = Deaths / Population = (17,752 / 9,249,338)*100,000 = 191.9
Population % Change = -11.24%
Population Difference = -1039698
Death Rate if Population was same as 2006-2012 = 188
_ _____________________________________

45-54 years old Crude Deaths 

7 Year Span Comparison
Had a -13.% crude death decrease   2013-2019 vs 2006-2012 - - - -  -6,024 less crude deaths in the recent 7 Year Span vs prior 7 years, 2013-2019 vs 2006-2012 = 40,409 - 46,433 = -6,024 less crude deaths in the recent 7 Year Span.  Michigan  Ages 45-54 years old had 40,409 crude deaths in the recent 7 years, 2013-2019.

Michigan adults ages 45-54 years crude death rate decreased -11.3 points comparing recent 7 year crude death rate  to prior 7, 2013-2019 vs 2006-2012 death rates = 429.5 - 440.8 = -11.3 death rate point increase in the recent 7 yr period."
"Calculation for Percent Change = ((New Value - Old Value)/ Old Value )*100 =  -13.% =
 ((2013-2019 Crude deaths - 2006-2012 Crude deaths ) / (2006-2012 Crude deaths ))*100  = ((40,409 - 46,433) / ( 46,433))*100 = ((-6,024)  / ( 46,433))*100  = -13.% crude death increase for ages 45-54 years old
2013-2019 Death Rate = Crude Deaths / Population = (40409 / 9407567)*100,000 = 429.5
2006-2012 Death Rate = Crude Deaths / Population = (46433 / 10533484)*100,000 = 440.8
Population % Change = -10.69%
Population Difference = -1125917
Death Rate if Population was same as 2006-2012 = 383.6
Michigan death rate ages 45-54 years old 429.5 is 28 points 'higher, WORSE than' U.S. DR 45-54 years old 401.6.
______________________________________
55-64 years old Crude Deaths 
7 Year Span Comparison

Michigan adults ages 55-64 years had a 16.8% crude death increase   2013-2019 vs 2006-2012 - - - -  12,896 more crude deaths in the recent 7 Year Span vs prior 7 years, 2013-2019 vs 2006-2012 = 89,580 - 76,684 = 12,896 more crude deaths in the recent 7 Year Span.  Michigan  Ages 55-64 years old had 89,580 crude deaths in the recent 7 years, 2013-2019.

Michigan adults ages 55-64 years crude death rate increased 24.8 points comparing recent 7 year crude death rate  to prior 7, 2013-2019 vs 2006-2012 death rates = 924.2 - 899.4 = 24.8 death rate point increase in the recent 7 yr period."

Calculation for Percent Change = ((New Value - Old Value)/ Old Value )*100 =  16.8% =
 ((2013-2019 Crude deaths - 2006-2012 Crude deaths ) / (2006-2012 Crude deaths ))*100  = ((89,580 - 76,684) / ( 76,684))*100 = ((12,896)  / ( 76,684))*100  = 16.8% crude death increase for ages 55-64 years old
2013-2019 Death Rate = Crude Deaths / Population = (89580 / 9692873)*100,000 = 924.2
2006-2012 Death Rate = Crude Deaths / Population = (76684 / 8526322)*100,000 = 899.4
Population % Change = 13.68%
Population Difference = 1166551
Death Rate if Population was same as 2006-2012 = 1050.6
Michigan death rate ages 55-64 years old 924.2 is 46.1 points 'higher, WORSE than' U.S. DR 55-64 years old 878.1.

65-74 years old Crude Deaths

7 Year Span Comparison

Michigan adults ages 65-74 years had a 26.4% crude death increase   2013-2019 vs 2006-2012 - - - -  26,224 more crude deaths in the recent 7 Year Span vs prior 7 years, 2013-2019 vs 2006-2012 = 125,649 - 99,425 = 26,224 more crude deaths in the recent 7 Year Span.  Michigan  Ages 65-74 years old had 125,649 crude deaths in the recent 7 years, 2013-2019.

Michigan adults ages 65-74 years crude death rate decreased -90.4 points comparing recent 7 year crude death rate  to prior 7, 2013-2019 vs 2006-2012 death rates = 1910.5 - 2000.9 = -90.4 death rate point increase in the recent 7 yr period."

Calculation for Percent Change = ((New Value - Old Value)/ Old Value )*100 =  26.4% =
 ((2013-2019 Crude deaths - 2006-2012 Crude deaths ) / (2006-2012 Crude deaths ))*100  = ((125,649 - 99,425) / ( 99,425))*100 = ((26,224)  / ( 99,425))*100  = 26.4% crude death increase for ages 65-74 years old
2013-2019 Death Rate = Crude Deaths / Population = (125649 / 6576759)*100,000 = 1910.5
2006-2012 Death Rate = Crude Deaths / Population = (99425 / 4968926)*100,000 = 2000.9
Population % Change = 32.36%
Population Difference = 1607833
Death Rate if Population was same as 2006-2012 = 2528.7
Michigan death rate ages 65-74 years old 1910.5 is 123.6 points 'higher, WORSE than' U.S. DR 65-74 years old 1786.9.
______________________________________

75-84 years old Crude Deaths

7 Year Span Comparison
Michigan adults ages 75-84 years had a -2.1% crude death decrease   2013-2019 vs 2006-2012 - - - -  -3,365 less crude deaths in the recent 7 Year Span vs prior 7 years, 2013-2019 vs 2006-2012 = 157,863 - 161,228 = -3,365 less crude deaths in the recent 7 Year Span.  Michigan  Ages 75-84 years old had 157,863 crude deaths in the recent 7 years, 2013-2019.

Michigan adults ages 75-84 years crude death rate decreased -325.9 points comparing recent 7 year crude death rate  to prior 7, 2013-2019 vs 2006-2012 death rates = 4804.1 - 5130. = -325.9 death rate point increase in the recent 7 yr period.
Calculation for Percent Change = ((New Value - Old Value)/ Old Value )*100 =  -2.1% =
 ((2013-2019 Crude deaths - 2006-2012 Crude deaths ) / (2006-2012 Crude deaths ))*100  = ((157,863 - 161,228) / ( 161,228))*100 = ((-3,365)  / ( 161,228))*100  = -2.1% crude death increase for ages 75-84 years old
2013-2019 Death Rate = Crude Deaths / Population = (157863 / 3285977)*100,000 = 4804.1
2006-2012 Death Rate = Crude Deaths / Population = (161228 / 3142841)*100,000 = 5130
Population % Change = 4.55%
Population Difference = 143136
Death Rate if Population was same as 2006-2012 = 5022.9
Michigan death rate ages 75-84 years old 4804.1 is 320 points 'higher, WORSE than' U.S. DR 75-84 years old 4484.2.
Alabama 15-34 S)(Alaska 15-34 S), (Arizona 15-34 S), (Arkansas 15-34 S), (California 15-34 S), (Colorado 15-34 S), (Connecticut 15-34 S), (Delaware 15-34 S), (District of Columbia 15-34 S),  (Florida 15-34 S), (Georgia 15-34 S), (Hawaii 15-34 S), (Idaho 15-34 S), (Illinois 15-34 S), (Indiana 15-34 S), (Iowa 15-34 S), (Kansas 15-34 S),  (Kentucky 15-34 S), (Louisiana 15-34 S), (Maine 15-34 S),  (Maryland 15-34 S), (Massachusetts 15-34 S), (Michigan map 15 15-34 S), (Minnesota 15-34 S),  (Mississippi 15-34 S), (Missouri 15-34 S), (Montana 15-34 S), (Nebraska 15-34 S), (Nevada 15-34 S),  (New Hampshire 15-34 S), (New Jersey 15-34 S), (New Mexico 15-34 S), (New York 15-34 S), (North Carolina 15-34 S), (North Dakota 15-34 S), (Ohio 15-34 S), (Oklahoma 15-34 S), (Oregon 15-34 S),  (Pennsylvania 15-34 S), (Rhode Island 15-34 S), (South Carolina 15-34 S), (South Dakota 15-34 S),  (Tennessee 15-34 S), (Texas 15-34 S), (Utah 15-34 S), (Vermont 15-34 S), (Virginia 15-34 S),  (Washington 15-34 S), (West Virginia 15-34 S), (Wisconsin 15-34 S), (Wyoming 15-34 S)  Colorado legalized rec weed 2012 warns consequences sick young devastation https://learnaboutsam.org/wp-content/uploads/2020/03/Colorado-One-Pager-39pdf.pdf?  

Michigan Current Report: (Michigan map 15-34 S)

Michigan 7 years 2013-2019 (Historical Report):

Michigan moved up 5 sickening notches from#18 to #13 top-worst death rate state in U.S. recent 7 years compared to seven years prior 2013-2019 versus 2006-2012.

County death rates are so bad, 88% of Michigan counties have a death rate worse than U.S. DR 848.8 during same period. Michigan death rate 967.3 is 118.6 points higher, worse than U.S. DR (death rate) 848.8 2013-2019.

Michigan, like other states bordering the St. Lawrence seaway, had CRITICAL crude death rate increase as illicit substances increase through port cities the same time marijuana, vape, alcohol, tobacco and xanax increase, this is increasing young deaths which increases overall state deaths, Michigan had CRITICAL significant 82.7 point death rate increase recent 7 year death rate versus prior 7 years, 2013-2019 vs 2006-2012 death rates = 967.3 - 884.7 = 82.7 death rate point increase in the recent 7 yr period. 

If Michigan doesn't change, soon all counties will be in the RED, no green low death rate counties. Only 10 green Michigan counties left with death rates, under U.S. death rate 848.8 (many of these counties had significant young death increase in recent seven years, are moving in the worst destruction direction)!!!

Alcona is the #1 top worst death rate in Michigan recent seven years, its death rate is 924.7 points higher than U.S. during same period - ALCONA NEEDS SUPPORT, EXPECIALLY YOUNG PEOPLE IN ALCONA! 

Calling all Christians in Michigan to build the Kingdom of God for children, the Kingdom of God is at hand, time for Michigan to turn to God/Jesus for support, fill up the churches - turn away from false idols which bring destruction and early death. Alcona and Wayne County kids especially need support to help the very young avoid substances completely as they enter teen years.


==========================================================================
Mind-altering substances impact crude deaths:  View Michigan mind-altering substance deaths  https://hiskingdomwematter.blogspot.com/p/us-substance-deaths-2013-2017-5-year.html
The impact of the poison team working together cannot be discounted.  The poison team is the tobacco, vaping and Marijuana groups working together instituting getting people sick/addicted, acting like they are doing good when in fact they are working to harm.  If we do not work to stop their poison, it will continue:
1.     Deceptively disguise poison product in apparatus, oils, lotions, makeup and food with smells and flavors for no good reason other than to get people addicted.  Market to kids putting it in gummy bears, nerds, candy bars, etc.  For example, adding a flavoring to an antibiotic a child needs to fight a horrible bacterial infection, is helping the child take the medication they need for a specific time period to fight infection.  Marijuana and tobacco companies exist to entice people into addiction with no end, they want your money, there isn't anything good about it.  Maybe they are addicted and don't realize they are doing it, which is all the more reason to work together to limit situation. 
2.     Doesn’t warn voters or customers they aim to institute dangerous mind-altering substance OVER-PRESCRIBING which has a history of increased young deaths in areas it occurs.  Mind-altering substances normally have a two-week prescribing limit for safety purposes.  Instead of instituting safe two-week prescribing limit, in Michigan they directed a bill to propose heavy over-prescribing (2.5 ounces is heavy over-prescribing 4.5 months).  As such, young deaths increased.  Recreational is an extreme form of over-prescribing, it has no limits - it takes doctors out of the prescribing process, eliminates medical safety, it is no wonder people end up strung out on drugs, homeless, can’t think straight because regulations that protected the young, old and special needs were eliminated by these groups.  Their goal is to dump mind-altering substances into communities deceptively acting like it will make money for the community, without noting cost to human beings of instituting misery as mind altering substance use increases in an area - accidents, suicides, deaths, homelessness, runaways, prostitution, violence, human trafficking, theft, arrests, child abuse and sicknesses increase due to the high/drunk deceiving effect a mind-altering substance has on a person. Marijuana is a mind-altering substance.  
3.     Doesn't warn voters or customers they work to institute extreme addictive strength (see notes below about dabbing and vapingso people are addicted with first try.  They call it improving their product when in fact their aim is to get people addicted to increase customers.  Poison team posts deceiving signs without posting a bigger sign that their stuff is poison that it hurts people.  They implemented nuclear addictive strength of THC without noting EXTREME inherent addiction danger what it really does to people - takes money, takes mind off good goals to feed marijuana/tobacco addiction because addiction means a person hurts to do normal everyday things now without the drug, has to start day with tobacco/marijuana to move forward to think without hurting and that is very bad.  
4.     Doesn’t warn voters many will become ill with addiction, will need recovery, see Marijuana Treatment admissions below. 
5.     Doesn’t promote or support recovery when 3% THC (or low-level nicotine) no longer works, instead of promoting recovery they push more drug use.  A teen addicted to THC gets older, reaches legal drinking age and drives, may reach for an alcoholic drink during a celebration, their addiction begins to double.  As addiction increases, the ability to make good decisions decreases, depression sets in as substances begin to wear off, they might reach for a substance to feel better. Soon young adults start losing control, at the same time, there are other deadly poisonous mind-altering substances that have entered the state such as meth, opiates, cocaine and Xanax, etc.  Illicit drugs increase in areas where marijuana is instituted, which is very bad for community, young people and families. 
6.     Doesn’t warn voters or customers marijuana increases risk of psychosis, risk of violence associated with psychosis  and schizophrenia  https://twitter.com/i/status/1226739682412724225
A.  Prohibit marijuana before age 34 years old is an effective strategy in preventing opioid use disorder in young adults , prevention strategy against opioid addiction, especially in high risk groups will effectively reduce teen and young adult substance deaths  https://www.ncbi.nlm.nih.gov/pubmed/31962227

B.  Prohibit Marketing of mind-altering substances:  Good laws prohibiting marketing of tobacco cigarette use, effectively removed nicotine from the young crowd to near non-existent, see green line in link. Safe laws will move young deaths into non-existent too.  Prohibit marketing of mind-altering substances (e.g., vaping, tobacco, hookah, marijuana, PCP, acid, mushrooms, etc.) in any form (edibles, oils, lotions, make-up, drinks, cigarettes, blunts, dried or wet) on radio, internet, cable, television, signs, news posts, sporting events, magazines, newspapers, point of sales and social media (Facebook, twitter, Instagram, snapchat, YouTube, LinkedIn, messenger, pin-interest).  https://hiskingdomwematter.blogspot.com/p/safe-laws-moved-tobacco-into-near.html

-------------------------------------------------------------------------------------------------

    The news is flooding with posts of very poisonous mind altering substances entering the U.S. When mind altering substances increase in an area - accidents, suicides, homelessness, runaways, prostitution, human trafficking, violence, theft, arrests and sicknesses increase due to the high/drunk deceiving effect a mind-altering substance has on a person. Posts of drugs entering the U.S. https://www.facebook.com/Deceiving-Mind-Altering-Substances-108941933885096
    -------------------------------------------------------------------------------------------------
    Crude death is a measure of all deaths for a specified period and age group.  This is a crude death report; thus, this report includes all deaths including, sickness, accidents, suicide, violence and all mind-altering substance deaths (e.g., opiates, narcotics, marijuana, vaping, alcohol, meth, sedatives, benzodiazepines, tranquilizers, Xanax, stimulants, cocaine, hallucinogens, tobacco, etc.
    -------------------------------------------------------------------------------------------------
    When a person is suffering from a physical addiction “unrecovered" (without protected recovery and support), a person sometimes reaches for another mind-altering substance to deal with hard withdraw, as such, addiction increases. Substances have increased in variety and poisonous strength.
    -------------------------------------------------------------------------------------------------
    When mind altering substances increase in an area - accidents, suicides, homelessness, runaways, prostitution, violence, human trafficking, theft, arrests and sicknesses increase due to the high/drunk deceiving effect a mind-altering substance has on a person. Marijuana is a mind-altering substance. 
    -------------------------------------------------------------------------------------------------
    Cap It
    Without limits, a mind-altering substance becomes an accidental abuse.  Blue Cross Blue Shield of Michigan announced in 2018  it will cap, limit its members' opioid prescriptions to 30 days, and in some cases, five days in efforts to address the opioid epidemic in both its state and the nation.  Limits protect health, prevent over-prescribing and help decrease addiction and accidental deaths, https://www.thefix.com/new-opioid-script-limits-announced-blue-cross-michigan.
    ************************************************************************************
    Over-prescribing:  Over-prescribing a mind-altering substance has a history of making its way to young people, with devastating results. Young crude deaths tend to increase in areas where lax mind-altering substance laws like over-prescribing are instituted, death rates go up.  Limits should be placed on ALL mind-altering substances to prevent them from reaching a crowd of people for which they were not intended, young people.   For example, in West Virginia between 2006 and 2016, drug distributors shipped large quantities of opiate hydrocodone and oxycodone to two pharmacies in Williamson at the same time a doctor overprescribed.  As such, West Virginia Age 15-34-year-old crude death rate increased to 139.3 is 48.6 points higher than US death rate 90.7 during the same year period 2012-2016!!  See link to view West Virginia article.   https://www.wvgazettemail.com/news/health/drug-firms-shipped-m-pain-pills-to-wv-town-with/article_ef04190c-1763-5a0c-a77a-7da0ff06455b.html  

    Medicinal Marijuana heavy over-prescribing in Michigan #####################
    The 2008 Michigan marijuana law voted in allowed a physician to prescribe medical marijuana to a patient giving the patient the ability to carry and possess marijuana up to 2.5 ounces of medical marijuana. http://norml.org/legal/item/michigan-medical-marijuana   In 2008, the 2.5 ounces of marijuana never should not have been brought to voters written in such a way that it left out important details stating this bill includes heavy over-prescribing a mind-altering substance and the ramifications this increase presents to young people, young deaths tend to increase in areas where it is implemented.   Before the 2008 marijuana bill was brought to Michigan voters, it should have been clarified to voters it included heavy over-prescribing, and the ramifications over-prescribing presents to an area.   Over-prescribing does not do well for young people in the area, young crude deaths tend to increase in areas where lax mind-altering substance laws are instituted.  When mind altering substances increase in an area - accidents, suicides, homelessness, runaways, prostitution, violence, theft, arrests and sicknesses increase due to the high/drunk deceiving effect a mind-altering substance has on a person.  Boulder County, is the first county in Colorado to implement recreational marijuana, experienced horrible tragic young death increase.  
    One standard average marijuana joint-cigarette = is 0.5 grams
    1 ounce equals 28.3495231 Grams
    28.3495231 Grams x (1 joint/ 0.5 grams) = 56.6990462 joints
    1 ounce equals 56.699 0462 joint cigarettes (0.5 grams)
    2.5 ounces x 28.3495231 = 70.87380775 grams (1 joint/0.5 grams) = 141 joints

    Cap it:  A 2-4 week limit should be placed on ALL mind altering substances to prevent them from reaching a crowd of people for which they were not intended, young people.  Instead of limits, heavy over-prescribing occurred in 2008.  Over-prescribing a mind-altering substance has a history of making it's way to people not intended, such as young people, with devastating results. Additionally no limits placed on potency, in some cases increased 2,567%.

    Instead of a 2-4 week limit, Michigan medical marijuana made a way for people to drive around with a lot of weed a 4.5 month supply of weed, which is heavy over-prescribing - 141 medical marijuana joints of a 0.5 gram size, a 4.5 month supply of medical marijuana which is 2.5 ounces of marijuana. The 2008 MI medicinal marijuana allowed a physician to prescribe a patient 2.5 ounces of marijuana, which equals 141 medical marijuana joints of a 0.5 gram size, a 4.5 month supply of medical marijuana, way over-prescribing. The bill just said a physician can prescribe 2.5 ounces of marijuana, the majority of voters didn't smoke marijuana, don't realize 2.5 ounces is a 4.5 month supply of weed.  This assumes a patient smokes a 0.5 gram marijuana joint each day, which is a lot.   As such, marijuana over-flow has been building up in Michigan since 2008, which coincides with death increases.  We were built to serve God, we were not built to serve misery bondage of mind-altering substances.  Getting off them is hard, it deceives the mind of the person using, thus it is really important to limit its' use.

    Two states allow twice the medicinal amount of Michigan (Delaware and New Mexico) - medical marijuana laws in these states allow a patient to possess 6 ounces of marijuana (340 joints of .5 gram size), almost a year supply of medical marijuana, super heavy over prescribing!!!! With those amounts, young people in those states struggle way more than young people in Michigan. 2013-2017.   New Mexico age 25-34 year old death rate  190.6 is 72 points higher than the U.S. age 25-34 year old death rate 118.8 in the recent five year period 2013-2017, New Mexico had the 2nd highest age 25-34 year old crude death rate for ages 25-34 years old.  Delaware age 25-34 year old death rate 144.3 is 26 points higher than the U.S. age 25-34 year old death rate 118.8 in the recent five year period 2013-2017, Delaware had the 17th highest state death rate for ages 25-34 years old in the recent five year period 2013-2017    https://hiskingdomnumbersmatter.blogspot.com/p/us-ages-25-34-years-old-had-261988.html

    Recreational marijuana is a type of exponential heavy over-prescribing.  
    Over-prescribing a mind-altering substance has a history of making it's way to people not intended, such as young people, with devastating results. Over-prescribing does not do well for young people in the area, young crude deaths tend to increase in areas where lax mind-altering substance laws are instituted.
    (1). removes a doctor prescription so adults over 21 years old can use any time for any reason and
    (2). For example, in the Michigan ballot which went through in 2018, which proposed legalizing 10 ounces of marijuana, which equates to 567 marijuana joints, an 18 month daily supply of 0.5 gram size marijuana, a year and a half supply of marijuana allowed in homes in Michigan where people are over 21 years of age – EXPOTENTIAL heavy over-prescribing!  Mind-altering substances should have no more than a 2-4-week supply, see Cap It above. 
    (3). The Michigan ballot legalized allowing 2.5 ounces (141 joints can be sitting in any house out in the open) a 4.5-month supply of marijuana can be sitting out in the open in any home a child could enter in Michigan --- which is NOT safe for young people who live in the area!!
    ------------------------------------------------------------------------------
    For example, Colorado, a recreation marijuana state, had a 27% increase in young crude deaths for ages 25-34 years old comparing the five year span 2012-2016 to the five years prior 2007-2011,  901 more crude deaths in the five year span following recreational marijuana implementation versus the five years prior, 2012-2016 vs 2007-2011 = 4,232 - 3,331 = 901 more crude deaths in the five year span 2012-2016. Colorado had 4,232 age 25-34 year old crude deaths in the 5 year period, 2012-2016.  After recreational marijuana was implemented, Colorado age 25-34 year old crude death rate increased significantly 12.4 points comparing 2012-2016 vs 2007-2011 death rates = 105.6 - 93.2 = 12.4 death rate point increase.

    Marijuana THC Increased  317% in a 0.5 gram joint between 1990 and 2013
    THC is the addictive part that gets a person high.  The potency of a marijuana cigarette increased from 3 percent THC in 1990's to 12.5 percent THC in 2013.  NIDA (National Institute on Drug Abuse); National Institutes of Health; U.S. Department of Health and Human Services web site 9-28-19, https://www.drugabuse.gov/about-nida/legislative-activities/testimony-to-congress/2014/mixed-signals-administrations-policy-marijuana-part-four-scientific-focus-adverse-health  NIDA (National Institute on Drug Abuse) (June 20, 2014) Mixed Signals: The Administration’s Policy on Marijuana, Part Four -- Scientific Focus on the Adverse Health Effects of Marijuana Use https://archives.drugabuse.gov/testimonies/2014/mixed-signals-administrations-policy-marijuana-part-four-scientific-focus-adverse-health-effects NIDA. 2014, June 20. Mixed Signals: The Administration’s Policy on Marijuana, Part Four -- Scientific Focus on the Adverse Health Effects of Marijuana Use. Retrieved from NIDA. 2014, June 20. Mixed Signals: The Administration’s Policy on Marijuana, Part Four -- Scientific Focus on the Adverse Health Effects of Marijuana Use. Retrieved from https://archives.nida.nih.gov/about-nida/legislative-activities/testimony-to-congress/2014/mixed-signals-the-administration%E2%80%99s-policy-on-marijuana-part-four----scientific-focus-on-the-adverse-health-effects-of-marijuana-use

    1.    A standard marijuana cigarette-joint size is 0.5 grams.
    2.    Standard Marijuana serving size set in the 1990s is 0.015 grams of 100% THC
    3.    1990 THC 3%, multiply the 1990 THC 3% by 0.5 grams (standard joint size)  = 0.03x0.5=0.015 grams THC per 0.5 gram joint. Based on this information, the standard Marijuana serving size set in the 1990s is 0.015 grams of 100% THC.               
    4.    2013 THC 12.5%:  According to NIDA average Marijuana THC increased to 12.5% percent THC in 2013 = 12.5/100=0.125 THC x 0.5 grams (joint size) = 0.0625 grams of 100% THC, which is a 317% increase in THC between 1990 and 2013!!!! 

    5.    Percent Increase - % change calculation 1990 vs 2013 THC = ((NewValue— OldValue) / OldValue) x 100 = ((THC1990 - THC2013)/ THC2013) x100 = ((0.0625-0.015) / 0.015) x100 = ((0.0475) / 0.015) x100 = 317% increase in THC between 1990 and 2013 (THC is the addictive part that gets a person high).  THC grams increased 317% between 1990 and 2013 in a 0.5 grams serving.  This made it's way to teens 😭, way more addictive than 30 years ago!  Each time a teen smokes a 2013 joint it is equal to smoking four 1990 joints in one setting!  Many teens are smoking daily, so in one week they are smoking the equivalent of twenty-eight 1990 marijuana joints a week, way more THC.  Marijuana wasn't good to teens that smoked a joint in the 1990s, the grams of THC increased 317% (1990 versus 2013), way more high and addictive today.  THC gets a person high like alcohol in beer or wine gets a person drunk.  Vaping exploded overnight, and many teens are vaping, not because they like vaping, it hurts when they try to stop, some run away, become homeless because the pain of trying to quit is that bad.  THC gets a person high, 317% more high, more addictive since 2013.  It is like drinking a bunch of vodka, suddenly addicted, only you don’t vomit or slur words, every part of a day focuses on getting enough THC to not hurt while trying to complete responsibilities.

    Marijuana Exponential Toxic Concentrates (wax, budder, shatter, oils, dabbing, extracts, gummies, candy, cookies, edibles) THC in some cases increased  as much as 2,567%in a 0.5 gram joint between 1990 and 2013
    According to NIDA, marijuana concentrates can have, 50-80% THC, High potential for Addiction! https://www.drugabuse.gov/about-nida/legislative-activities/testimony-to-congress/2014/mixed-signals-administrations-policy-marijuana-part-four-scientific-focus-adverse-health  Marijuana extracts reach young people if we do not include cap boundaries to protect young people.  THC is the element in marijuana that gets people high & addicted,  like alcohol is the element in beer/wine that gets people drunk and addicted.

    According to NIDA Marijuana Oils and Extracts can be as as high as 80% THC 
    6.    80% THC Concentrate = 80/100 = 0.80 THC x 0.5 grams (joint size) = 0.4 grams of 100% THC is a 2,567% increase in THC between 1990 and 2013!   A 2,567% THC increase is equivalent to smoking twenty-six 1990 joints in one 0.5 gram joint! This is what teens confront today, that is toxic potent!!  Trying to get off the stuff, teens sometimes reach for another worse substance.  The grams of THC increased 2,567% from 1990 to 80% concentrate today  — way more high, addictive today!!!!  However the good news, with God, encouragement, recovery and truthful support, many admit it is horrible to be addicted, receive help, go on to lead sober recovered good lives.

    7.    Percent Increase - % change calculation (3% THC versus 80% THC) = (((NewValue— OldValue) / OldValue) x 100 = ((0.4-0.015) / 0.015) x100 = 2,567% THC increased as much as 2,567% in a 80% THC marijuana extract or wax or oil between 1990 and 2013.  Each time a teen vapes one of these it is equal to smoking twenty-six 1990 joints in one setting, 💔😭 exponentially addictive, it no longer takes years to get addicted, it happens with the first try - this is why it is important to protect teens, put lids on mind-altering substances so there is no over-flow.  Colorado leads the nation in first time marijuana use by those aged 12–17, representing a 65% increase in adolescent use since legalization  https://www.ncbi.nlm.nih.gov/pmc/articles/PMC6312155/

    Emergency Room (ER) Marijuana Admissions increase ALOT
    1.    Marijuana admissions increased 96% (2004 versus 2011)  A rapid rise in emergency room (ER) admissions linked to marijuana use attests to the greater dangers of acute use. There were 128,857 ER visits related to marijuana use in 2011, nearly double the number from 2004 (65,699).  Thus, Emergency room visits related to marijuana increased 96%, 2011 compared to 2004=((128,857-656,99)/656,99)x100 = 96%!!  NIDA (National Institute on Drug Abuse) (June 20, 2014) Mixed Signals: The Administration’s Policy on Marijuana, Part Four -- Scientific Focus on the Adverse Health Effects of Marijuana Use https://archives.drugabuse.gov/testimonies/2014/mixed-signals-administrations-policy-marijuana-part-four-scientific-focus-adverse-health-effects
    2.    Colorado Children hospital admissions for marijuana injury admissions increase 382% (2005 versus 2015).  Lax Marijuana laws seriously hurting children Colorado, un-necessary substance companies making money at the expense of children in area.  Denver area, visits to Children’s Hospital Colorado facilities for treatment of cyclic vomiting, paranoia, psychosis and other acute marijuana cannabis-related symptoms jumped to 777 in 2015, from 161 in 2005, a 382% increase acute cannabis (marijuana) hospital instances.  https://www.washingtonpost.com/national/potent-pot-vulnerable-teens-trigger-concerns-in-first-states-to-legalize-marijuana/2019/06/15/52df638a-8c9a-11e9-8f69-a2795fca3343_story.html 

    Marijuana Treatment admissions
    1.    The number of Marijuana public treatment admissions in Michigan attests to the higher marijuana potency, see page 15 of this report.  This report also indicates very potent addictive substances are in Michigan in which residents are suffering (alcohol, heroin, opiates, cocaine, marijuana, methamphetamine, etc.).  As such, we should do everything possible to uphold safe laws for residents and implement extra measures during this critical period to be sure we are supporting our most vulnerable residents, lax laws recklessly endanger vulnerable citizens.    https://www.michigan.gov/documents/msp/FY18_Meth_Related_Criminal_Incidents_651356_7.pdf
    2.    The number of Marijuana U.S. treatment admissions attests to marijuana addiction, the higher volume of young marijuana treatment admissions validates the need to protect children and teens, eliminating overflow and keep marijuana baseline at 3%.  This report also indicates very potent addictive substances are in Michigan and in every U.S. state, in which residents are suffering (alcohol, heroin, opiates, cocaine, marijuana, methamphetamine, etc.).  As such, we should do everything possible to uphold safe laws for residents and implement extra safe strong stringent measures during this critical period to be sure we support our most vulnerable residents, lax laws recklessly endanger vulnerable citizens. Substance Abuse and Mental Health Services Administration, Center for Behavioral Health Statistics and Quality. Treatment Episode Data Set (TEDS): 2005-2015. State Admissions to Substance, Abuse Treatment Services. BHSIS Series S-95, HHS Publication No. (SMA) 17-4360. Rockville,MD: Substance Abuse and Mental Health Services Administration, 2017.  https://www.samhsa.gov/data/sites/default/files/2015%20TEDS_State%20Admissions.pdf
    ------------------------------------------------------------------------------
    Marijuana has a strong potential for abuse and is classified as a schedule Ι drug.
    ------------------------------------------------------------------------------
    Teen Vaping in Michigan is wide spread and young addiction and daily use is increasing (click link scroll down to see vape numbers by county)  https://www.mlive.com/news/2019/09/why-is-vaping-so-bad-for-teenagers.html

    Michigan as a state started suffering when medicinal marijuana and vaping came to town with lax over-prescribing laws that didn't tell the truth.  In the 1990s teens didn’t have to deal with vaping.  Vaping and marijuana as a publicly sold entity were not needed in the past, Michigan teens did well without them, look what happened to teens today with current lax safety laws for medicinal, recreational, tobacco and vaping apparatus laws, this is sad!.  About 30% of Michigan 11th-graders, 20% of ninth-graders and 7% of seventh-graders used e-cigarettes in the past month in the last month!  According to CDC, there are 131,824  sixteen-year-olds in Michigan per 2017 latest data.  So how many eleventh graders were hurt by e-cigarettes (vaping hurts the lungs).  Multiply Michigan 11 grade vaping percent 30.0% by Michigan eleventh grade age 16 year old population 131,824 =30/100=0.3 x 131,824 sixteen year old Michigan CDC population = 39,547 sixteen year olds in Michigan potentially used e-cigarettes in the past month multiplying survey percentages by Michigan 16 year old population, vaping e-cigarettes is addictive, hurts lungs, etc.  Vaping Source: in online in this article scroll down https://www.mlive.com/news/2019/09/why-is-vaping-so-bad-for-teenagers.html  Population Source: Centers for Disease Control and Prevention, National Center for Health Statistics. Underlying Cause of Death1999-2017 on CDC WONDER Online Database, released December, 2018. Data are from the Multiple Cause of Death Files, 1999-2017, ascompiled from data provided by the 57 vital statistics jurisdictions through the Vital Statistics Cooperative Program. Accessed

    How do we know marijuana is making its way to the hands of teens, a sad note by NIDA, (National Institute on Drug Abuse); National Institutes of Health; U.S. Department of Health and Human Services, 
    Marijuana is the most commonly used illicit drug in the United States by teens and adults
    NIDA, indicates Marijuana is the most commonly used illicit drug in the United States by teens and adults.
    U.S. Daily Teen marijuana use (A)  - - - - - - DAILY USE IS SERIOUS TEEN ADDICTION, TEENS STRUGGLING, STUCK ON un-necessary mind-altering substance marijuana, lungs hurt, minds going in circles around it, finances repeatedly going to it, hard way to start their future (prayers for the young people that they recover and that adults rectify this critical situation affecting young people, that godly sober-minded safe standards are implemented, education and strict lids on marijuana to prevent the next generation of teens from stepping into mind-altering substances, in Jesus name I pray)!
    Daily use of marijuana
    Daily teen marijuana use is a sign of physical marijuana addiction. 
    Daily U.S. teen marijuana usage increased significantly in 8th, 10th and 12 grades 2019 compared to 2018 rates.  


NIDA U.S. 2019 survey indicates significant increase in teen daily marijuana users (column F). 
SO, POTENTIALLY, HOW MANY TEENS ARE USING MARIJUANA DAILY?? 

Multiply survey “daily marijuana use” percent by population to potentially see the number of teen daily marijuana users (column H) DxG=H.  Based on this calculation:

Tenth graders have 266% more marijuana daily users compared to younger 8th graders age 13 years old.  Calculation for percent change is ((NewValue - OldValue) / OldValue)*100 = ((Age 15 year old daily users - Age 13 year old daily users)/Age 13 year old daily users)*100 = (197,499 - 54,019 / 54,019  = 266% increase in 10th grade daily marijuana users age 15 years old compared to younger 8th graders age 13 years old.  There are potentially 143,480 more 10th grade daily marijuana users age 15 years old age versus 8th graders age 13 years old.  U.S. potentially has 54,019 8th grade thirteen-year-old daily marijuana users and 197,499 10th grade fifteen-year-old daily marijuana users.    

Seniors, twelfth graders have 39% more marijuana daily users compared to younger 10th graders age 15 years old.  Calculation for percent change is ((New Value - Old Value) / Old Value)*100 = (((Age 17 year old daily users - Age 15 year old daily users)/Age 15 year old daily users)*100 = ( 274,981  -  197,499 / 197,499  = 39% increase in 12th grade daily marijuana users age 17 years old compared to younger 10th graders age 15 years old.  There are potentially 77,482  more 12th grade daily marijuana users age 17 years old age versus 10th graders age 15 years old.  U.S. potentially has 274,981 12th grade seventeen year old daily marijuana users.

Marijuana Source: NIDA (National Institute on Drug Abuse); National Institutes of Health; U.S. Department of Health and Human Services, How many teens use marijuana?  Accessed 12-26-2019 https://teens.drugabuse.gov/drug-facts/marijuana
Population Source: Centers for Disease Control and Prevention, National Center for Health Statistics. Underlying Cause of Death
1999-2017 on CDC WONDER Online Database, released December, 2018. Data are from the Multiple Cause of Death Files, 1999-2017, as
compiled from data provided by the 57 vital statistics jurisdictions through the Vital Statistics Cooperative Program. Accessed

U.S. Daily Teen marijuana use (B)


         NIDA (National Institute on Drug Abuse); indicates significant increase in young teen marijuana use 2019 compared to year prior 2018.
8th grade teen daily U.S. marijuana use increased 85.7%, 2019 versus 2018!
10th grade teen daily U.S. marijuana use increased 41.2 %, 2019 versus 2018!
Monitoring the Future Survey: High School and Youth Trends, Revised December 2019Source: NIDA (National Institute on Drug Abuse); National Institutes of Health; U.S. Department of Health and Human Services.  . December 18, 2019. Accessed December 28, 2019.  https://www.drugabuse.gov/publications/drugfacts/monitoring-future-survey-high-school-youth-trends

Daily mind-altering substance use is a sign of struggling with physical addictiondaily teen marijuana use increased a lot! Marijuana use can lead to marijuana use disorder, which takes the form of addiction in severe cases.  People who begin using marijuana before the age of 18 are four to seven times more likely to develop a marijuana use disorder than adults.19
NIDA (National Institute on Drug Abuse); National Institutes of Health; U.S. Department of Health and Human Services, Marijuana:  Is marijuana addictive?  Accessed 12-30-2019  https://www.drugabuse.gov/publications/research-reports/marijuana/marijuana-addictive
Teens Vaping
Daily Teen U.S. Vaping THC use
Daily teen THC vaping use is a sign of physical THC addiction. 
Daily U.S. teen THC usage increased significantly in 8th, 10th and 12 grades 2019 compared to 2018 rates.


NIDA U.S. 2019 survey indicates significant increase in Daily Teen THC Vaping (column F). 
So, potentially, how many teens are vaping THC daily?? 

Multiply survey "daily THC vaping" percent by population to potentially see the number of teens vaping THC daily (column H) DxG=H. 

Tenth graders in 2019 have 271% more THC daily vaping users compared to younger 8th graders age 13 years old.  Calculation for percent change is ((NewValue - OldValue) / OldValue)*100 = ((Age 15 year old daily THC vaping users - Age 13 year old daily THC vaping users)/Age 13 year old daily THC vaping users )*100 = (123,437 - 33,243 / 33,243 = 271% increase in 10th grade daily THC vaping users age 15 years old compared to younger 8th graders age 13 years old.  There are potentially 90,194 more 10th grade daily  THC vaping users age 15 years old age versus 8th graders age 13 years old.  U.S. potentially has 33,243 8th grade thirteen-year-old daily THC vaping users and 123,437 10th grade fifteen-year-old daily THC vaping users.   

Seniors, twelfth graders have 22% more THC daily vaping users compared to younger 10th graders age 15 years old.  Calculation for percent change is ((New Value - Old Value) / Old Value)*100 = (((Age 17 year old THC daily vaping users - Age 15 year old THC daily vaping users)/Age 15 year old THC daily vaping users)*100 = ( 150,380  -  123,437 / 123,437  = 22% increase in 12th grade THC daily vaping users age 17 years old compared to younger 10th graders age 15 years old.  There are potentially 26,943  more 12th grade THC daily vaping users age 17 years old age versus 10th graders age 15 years old.  U.S. potentially has 150,380 12th grade seventeen year old THC daily vaping users.

U.S. potentially has 307,059 ages 13, 15 and 17 year old THC daily vaping USERS , doesn't include ages 14, 16 or 18 years old.

Vaping Source: NIDA (National Institute on Drug Abuse); National Institutes of Health; U.S. Department of Health and Human Services, Monitoring the Future 2019 Survey Results: Vaping,  Accessed 12-30-2019 https://www.drugabuse.gov/related-topics/trends-statistics/infographics/monitoring-future-2019-survey-results-vaping
Population Source: Centers for Disease Control and Prevention, National Center for Health Statistics. Underlying Cause of Death
1999-2017 on CDC WONDER Online Database, released December, 2018. Data are from the Multiple Cause of Death Files, 1999-2017, as
compiled from data provided by the 57 vital statistics jurisdictions through the Vital Statistics Cooperative Program. Accessed

U.S. Past Month THC Teen Vaping
Past Month THC Teen Vaping increased significantly in 8th, 10th and 12 grades 2019 compared to 2018 rates. 
Past month marijuana vaping among 12th graders nearly doubled in a single year to 14% from 7.5%–the second largest one-year jump ever tracked for any substance in the history of the survey. “  NIDA. (2019, December 18). Vaping of marijuana on the rise among teens. Retrieved from https://www.drugabuse.gov/news-events/news-releases/2019/12/vaping-marijuana-rise-among-teens on 2019, December 30 


NIDA 2019 U.S. survey indicates significant increase in Past Month UseTHC Vaping (column F). 
So, potentially, how many teens vaped THC in the past month?? 

Multiply survey THC Vaping “past month use” percent by population to potentially see the number of teens vaping THC in the past month  (column H) DxG=H. 

Tenth graders in 2019 have 220% more THC past month vaping compared to younger 8th graders age 13 years old.  Calculation for percent change is ((NewValue - OldValue) / OldValue)*100 = ((Age 15 year old past month THC vaping - Age 13 year old past month  THC vaping)/Age 13 year old past month THC vaping )*100 = (518,435 - 162,057 / 162,057 = 220% increase in 10th grade past month  THC vaping age 15 years old compared to younger 8th graders age 13 years old.  There are potentially 356,377 more 10th grade past month  THC vaping age 15 years old age versus 8th graders age 13 years old.  U.S. potentially has 162,057 8th grade thirteen-year-old past month THC vaping users and 518,435 10th grade fifteen-year-old past month THC vaping users.   

Seniors, twelfth graders have 16% more THC past month vaping compared to younger 10th graders age 15 years old.  Calculation for percent change is ((New Value - Old Value) / Old Value)*100 = (((Age 17 year old THC past month vaping - Age 15 year old THC past month vaping)/Age 15 year old THC past month vaping)*100 = ( 601,521  -  518,435 / 518,435  = 16% increase in 12th grade THC past month vaping age 17 years old compared to younger 10th graders age 15 years old.  There are potentially 83,086 more 12th grade THC past month vaping age 17 years old age versus 10th graders age 15 years old.  U.S. potentially has 601,521 12th grade seventeen year old THC past month vaping users.      

U.S. potentially has 1,282,012  ages 13, 15 and 17 year old THC past month vaping users, doesn't include ages 14, 16 or 18 years old.      
                       
Vaping Source: NIDA (National Institute on Drug Abuse); National Institutes of Health; U.S. Department of Health and Human Services, Monitoring the Future 2019 Survey Results: Vaping,  Accessed 12-30-2019 https://www.drugabuse.gov/related-topics/trends-statistics/infographics/monitoring-future-2019-survey-results-vaping
Population Source: Centers for Disease Control and Prevention, National Center for Health Statistics. Underlying Cause of Death
1999-2017 on CDC WONDER Online Database, released December, 2018. Data are from the Multiple Cause of Death Files, 1999-2017, as
compiled from data provided by the 57 vital statistics jurisdictions through the Vital Statistics Cooperative Program. Accessed

U.S. Past Month Nicotine Teen Vaping


NIDA 2019 U.S. survey indicates significant increase in Past Month Nicotine Vaping Use (column F). 
So, potentially, how many teens vaped Nicotine in the pasts month?? 

Multiply survey Nicotine vaping “past month use” percent by population to potentially see the number of teens vaping Nicotine in the past month  (column H) DxG=H. 

Tenth graders in 2019 have 105% more Nicotine past month vaping compared to younger 8th graders age 13 years old.  Calculation for percent change is ((NewValue - OldValue) / OldValue)*100 = ((Age 15 year old past month Nicotine vaping - Age 13 year old past month  Nicotine vaping)/Age 13 year old past month Nicotine vaping )*100 = (818,797 - 398,910 / 398,910 = 105% increase in 10th grade past month  Nicotine vaping age 15 years old compared to younger 8th graders age 13 years old.  There are potentially 419,887 more 10th grade past month Nicotine vaping age 15 years old age versus 8th graders age 13 years old.  U.S. potentially has 398,910 8th grade thirteen-year-old past month Nicotine vaping users and 818,797 10th grade fifteen-year-old past month Nicotine vaping users.   

Seniors, twelfth graders have 34% more Nicotine past month vaping compared to younger 10th graders age 15 years old.  Calculation for percent change is ((New Value - Old Value) / Old Value)*100 = (((Age 17 year old Nicotine past month vaping - Age 15 year old Nicotine past month vaping)/Age 15 year old Nicotine past month vaping)*100 = ( 1,095,627  -  818,797 / 818,797  = 34% increase in 12th grade Nicotine past month vaping age 17 years old compared to younger 10th graders age 15 years old.  There are potentially 276,829  more 12th grade Nicotine past month vaping age 17 years old age versus 10th graders age 15 years old.  U.S. potentially has 1,095,627 12th grade seventeen year old Nicotine past month vaping users. "                                                                     
                                                                       
U.S. potentially has 2,313,334 ages 13, 15 and 17 year old Nicotine past month vaping USERS , doesn't include ages 14, 16 or 18 years old.

Vaping Source: NIDA (National Institute on Drug Abuse); National Institutes of Health; U.S. Department of Health and Human Services, Monitoring the Future 2019 Survey Results: Vaping,  Accessed 12-30-2019 https://www.drugabuse.gov/related-topics/trends-statistics/infographics/monitoring-future-2019-survey-results-vaping
Population Source: Centers for Disease Control and Prevention, National Center for Health Statistics. Underlying Cause of Death
1999-2017 on CDC WONDER Online Database, released December, 2018. Data are from the Multiple Cause of Death Files, 1999-2017, as
compiled from data provided by the 57 vital statistics jurisdictions through the Vital Statistics Cooperative Program. Accessed

U.S. DAILY Nicotine Teen Vaping
NIDA U.S. 2019 survey indicates significant increase in Daily Teen Nicotine Vaping Use (column F). 
So, potentially, how many teens are vaping Nicotine daily?? 

Multiply survey “daily nicotine vaping” percent  by population to potentially see the number of teens vaping nicotine daily (column H) DxG=H. 

Tenth graders in 2019 have 260% more Nicotine daily vaping compared to younger 8th graders age 13 years old.  Calculation for percent change is ((NewValue - OldValue) / OldValue)*100 = ((Age 15 year old daily Nicotine vaping - Age 13 year old daily  Nicotine vaping)/Age 13 year old daily Nicotine vaping )*100 = (283,905 - 78,951 / 78,951 = 260% increase in 10th grade daily  Nicotine vaping age 15 years old compared to younger 8th graders age 13 years old.  There are potentially 204,954 more 10th grade daily  Nicotine vaping age 15 years old age versus 8th graders age 13 years old.  U.S. potentially has 78,951 8th grade thirteen-year-old daily Nicotine vaping users and 283,905 10th grade fifteen-year-old daily Nicotine vaping users.   

Seniors, twelfth graders have 77% more Nicotine daily vaping compared to younger 10th graders age 15 years old.  Calculation for percent change is ((New Value - Old Value) / Old Value)*100 = (((Age 17 year old Nicotine daily vaping - Age 15 year old Nicotine daily vaping)/Age 15 year old Nicotine daily vaping)*100 = ( 502,699  -  283,905 / 283,905  = 77% increase in 12th grade Nicotine daily vaping age 17 years old compared to younger 10th graders age 15 years old.  There are potentially 218,795  more 12th grade Nicotine daily vaping age 17 years old age versus 10th graders age 15 years old.  U.S. potentially has 502,699 12th grade seventeen year old Nicotine daily vaping users. "                                                                     
U.S. potentially has a total of 865,555 ages 13, 15 and 17 year old Nicotine daily vaping USERS , doesn't include ages 14, 16 or 18 years old.
                                                                       
Vaping Source: NIDA (National Institute on Drug Abuse); National Institutes of Health; U.S. Department of Health and Human Services, Monitoring the Future 2019 Survey Results: Vaping,  Accessed 12-30-2019 https://www.drugabuse.gov/related-topics/trends-statistics/infographics/monitoring-future-2019-survey-results-vaping
Population Source: Centers for Disease Control and Prevention, National Center for Health Statistics. Underlying Cause of Death
1999-2017 on CDC WONDER Online Database, released December, 2018. Data are from the Multiple Cause of Death Files, 1999-2017, as
compiled from data provided by the 57 vital statistics jurisdictions through the Vital Statistics Cooperative Program. Accessed

Percent of U.S. 12 grade Students Reporting Marijuana, Cigarette, Vape Use in Past Month.  Burdening young people with marijuana and vaping is a horrible heavy way for students to start their future as adults, growing in God and recovery is the  only safe way to peace and love.  Eliminating Marketing of Mind Altering Substances Works - cigarette deaths were moving down to non-existent until the surge of medicinal, recreational and vaping occurred, much of their marketing now done in news posts and social media.  Remove marketing mind-altering substances on social media.
NIDA. (2019, December 18). Monitoring the Future Survey: High School and Youth Trends. Retrieved from https://www.drugabuse.gov/publications/drugfacts/monitoring-future-survey-high-school-youth-trends on 2019, December 31

Percent of U.S. Students Reporting Vaping in Past Month, by Type and Grade. {Wake up, Vaping is critical problem when 30% of seniors reported vaping in the past month!!!!!}  


Vaping Source:  NIDA. (2019, December 18). Monitoring the Future Survey: High School and Youth Trends. Retrieved from https://www.drugabuse.gov/publications/drugfacts/monitoring-future-survey-high-school-youth-trends on 2019, December 31
U.S. 2019 survey  by NIDA indicates past year Illicit Drug Usage among 12 grade students:   

Illicit Drug Use Source:  NIDA 2019 National Institute on Drug Abuse; National Institutes of Health; U.S. Department of Health and Human Services. Monitoring the Future 2019 Survey Results: Overall Findings. Retrieved from   https://www.drugabuse.gov/related-topics/trends-statistics/infographics/monitoring-future-2019-survey-results-overall-findings on 2019, December 31
Population Source: Centers for Disease Control and Prevention, National Center for Health Statistics. Underlying Cause of Death
1999-2017 on CDC WONDER Online Database, released December, 2018. Data are from the Multiple Cause of Death Files, 1999-2017, as
compiled from data provided by the 57 vital statistics jurisdictions through the Vital Statistics Cooperative Program. Accessed

U.S. Teen Past Year Marijuana Use
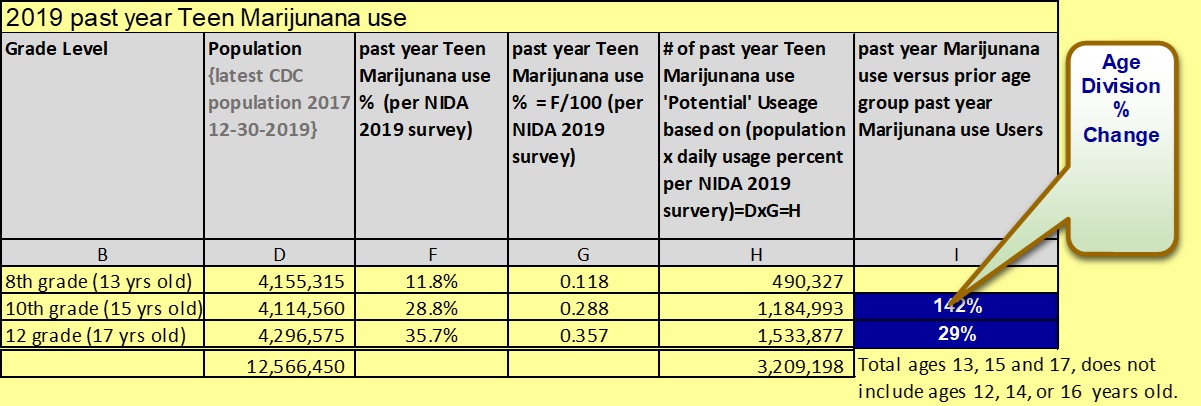
NIDA U.S. 2019 survey indicates significant increase in Past Year Marijuana Use (column F). 
So, potentially, how many teens used marijuana in the past year?? 

Multiply survey “past year marijuana use” percent by population to potentially see the number of teens who used Marijuana in the past year (column H) DxG=H. 

Tenth graders in 2019 have 142% more Marijuana past year use compared to younger 8th graders age 13 years old.  Calculation for percent change is ((NewValue - OldValue) / OldValue)*100 = ((Age 15 year old past year Marijuana use - Age 13 year old past year  Marijuana use)/Age 13 year old past year Marijuana use )*100 = (1,184,993 - 490,327 / 490,327 = 142% increase in 10th grade past year  Marijuana use age 15 years old compared to younger 8th graders age 13 years old.  There are potentially 694,666 more 10th grade past year Marijuana use age 15 years old age versus 8th graders age 13 years old.  U.S. potentially has 490,327 8th grade thirteen-year-old past year Marijuana use users and 1,184,993 10th grade fifteen-year-old past year Marijuana use users.   

Seniors, twelfth graders have 29% more Marijuana past year use compared to younger 10th graders age 15 years old.  Calculation for percent change is ((New Value - Old Value) / Old Value)*100 = (((Age 17 year old Marijuana past year use - Age 15 year old Marijuana past year use)/Age 15 year old Marijuana past year use)*100 = ( 1,533,877  -  1,184,993 / 1,184,993  = 29% increase in 12th grade Marijuana past year use age 17 years old compared to younger 10th graders age 15 years old.  There are potentially 348,884  more 12th grade Marijuana past year use age 17 years old age versus 10th graders age 15 years old.  U.S. potentially has 1,533,877 12th grade seventeen year old Marijuana past year use users.                                                                                                                        
 U.S. potentially has a total of 3,209,198 ages 13, 15 and 17 year old Marijuana past year use users, doesn't include ages 14, 16 or 18 years old.
                                                                       
Vaping Source: NIDA 2019 National Institute on Drug Abuse; National Institutes of Health; U.S. Department of Health and Human Services. Monitoring the Future 2019 Survey Results: Overall Findings. Retrieved from   https://www.drugabuse.gov/related-topics/trends-statistics/infographics/monitoring-future-2019-survey-results-overall-findings on 2019, December 31
Population Source: Centers for Disease Control and Prevention, National Center for Health Statistics. Underlying Cause of Death
1999-2017 on CDC WONDER Online Database, released December, 2018. Data are from the Multiple Cause of Death Files, 1999-2017, as
compiled from data provided by the 57 vital statistics jurisdictions through the Vital Statistics Cooperative Program. Accessed

Without limits, an addictive mind-altering substance becomes an abuse in which people in the area are hurt.  Young people are more vulnerable to addiction, that is why alcohol has a higher age limit, the younger a person starts, the more likely addiction spirals out of control.  Lids must be implemented to prevent weed and tobacco from reaching teens, it is not intended for them.  Someone drinking a bottle of vodka is really struggling, just as someone using heroin or fentanyl is really struggling. If a  physician or patient sees THC amount is going up by looking at history, it means his patient is getting addicted, is struggling, thus should engage the patient in counseling to prevent a serious addiction. If the patient is seeking marijuana to deal with a serious opiate or alcohol addiction, then a temporary different THC % and plan for recovery support might be needed.  A recovery plan with a sober godly focus must be put in place to prevent a more serious addiction in the wake of deadly substances which many young people accidentally overdose, see resources below.   It is our responsibility as parents, citizens and leaders to protect people, especially young and vulnerable people, with sober-minded safe laws that prevent over-prescribing and prevent marketing harmful mind-altering substances. 

Heavy Marijuana daily usage in Colorado validates serious marijuana addiction, it is so big it is changing the face of Colorado, very sad.  In just a few years, daily use in Colorado is averaging more than 5 points higher than the nation, Appendix Figure 2 reveals that Colorado has a much higher share of “heavy” marijuana consumers compared to the national average. Between 20.3-26.2 percent of the state’s marijuana consumers report near-daily use of marijuana (26 and over days), compared to just 15.5 percent nationwide. At the same time, the proportion of consumers who reported occasional marijuana use (less than one day per month) is much lower in Colorado (26.8 to 37.3 percent) compared to the national average (46.4 percent). 

MARKET SIZE AND DEMAND FOR MARIJUANA IN COLORADO 2017 MARKET UPDATE,  Prepared for the Colorado Department of Revenue, accessed 12-31-2019,   https://www.colorado.gov/pacific/sites/default/files/MED%20Demand%20and%20Market%20%20Study%20%20082018.pdf
----------------------------------------------------------------------------------------------------------------------------------
The founder of Bryan's Hope, Jeannie Richards, indicated reporting is needed to understand the magnitude of the substance problem to help people to recovery and to keep children sober and safe, prevent the next generation of children from stepping into the horrible mind-altering substance situation.  Jeannie was right, see mind-altering substance reports see link at bottom of this report page:
-----------------------------------------------------------------------------------------------------------------------------------
In this day teens and adults are confronted with a variety of critically addictive and poisonous substances while at the same time receive mixed messages from television, cable, internet, radio, songs and books about people using mind-altering substances without noting any real harm, which is wrong and deceiving. Turn away from this! Parents ask your schools how they teach children to recognize deception and how to turn away from it. 
-----------------------------------------------------------------------------------------------------------------------------------
Eliminating Marketing of Mind Altering Substances Works - marijuana and tobacco deaths were going down until the surge of medicinal, recreational and vaping occurred, much of their marketing now done in news posts and social media.

-----------------------------------------------------------------------------------------------------------------------------------
Michigan chart below is an example of what happens to people when lax laws are presented to voters and are allowed to exist, see chart below.  Crude deaths in Michigan were going down in ages 15-34 years old until 2008, when heavy over-prescribing happened. The 2008 Michigan marijuana law voted in allowed a physician to prescribe medical marijuana to a patient giving the patient the ability to possess marijuana up to 2.5 ounces of medical marijuana, a 4.5 month supply of medical marijuana. http://norml.org/legal/item/michigan-medical-marijuana   In 2008, the 2.5 ounces of marijuana never should not have been brought to voters written in such a way that it left out important details stating this bill includes heavy dangerous over-prescribing a mind-altering substance and the ramifications this increase presents to young people, young deaths tend to increase in areas where it is implemented.   Before the 2008 marijuana bill was brought to Michigan voters, it should have been clarified to voters it included heavy over-prescribing, and the ramifications over-prescribing presents to an area.   Over-prescribing mind-altering substances does not do well for young people in the area, young crude deaths tend to increase in areas where lax mind-altering substance laws are instituted.  When mind altering substances increase in an area - accidents, suicides, homelessness, runaways, prostitution, violence, theft, arrests and sicknesses increase due to the high/drunk deceiving effect a mind-altering substance has on a person.  Boulder County, is the first county in Colorado to implement recreational marijuana, experienced horrible tragic young death increase.  Cap it:  A 2-4 week limit should be placed on ALL mind altering substances to prevent them from reaching a crowd of people for which they were not intended, young people.  Instead of a 2-4 week limit, Michigan medical marijuana made a way for people to possess ?drive around with? a lot of weed a 4.5 month supply of weed, which is heavy over-prescribing - 141 medical marijuana joints of a 0.5 gram size is 2.5 ounces of marijuana. The 2008 MI medicinal marijuana allowed a physician to prescribe a patient 2.5 ounces of marijuana, which equals 141 medical marijuana joints of a 0.5 gram size, a 4.5 month supply of medical marijuana, heavy, dangerous, over-prescribing. The bill just said a physician can prescribe 2.5 ounces of marijuana, the majority of voters didn't smoke marijuana, didn't realize 2.5 ounces is at least a 4.5 month supply of weed, a very addictive mind-altering substance.  Assuming a patient smokes a 0.5 gram marijuana joint each day, which is a lot, this is a 4.5 month supply of weed, marijuana.   As such, marijuana over-flow has been building up in Michigan since 2008, which coincides with death increases in the chart below.  We were built to serve God, we were not built to serve misery of addiction bondage of mind-altering substances.  Trying to recover from a mind-altering substance is hard, it deceives the mind of the person using, thus it is really important to limit its' use.

Source for photo ages 15-34 years old substance and crude deaths by U.S.state selection MICHIGAN:
Centers for Disease Control and Prevention, National Center for Health Statistics. Dataset: Underlying Cause of Death. Data Accessed at http://wonder.cdc.gov/
Substance ICD List
The substance ICD list for this report is listed below. ICD (International Statistical Classification of Diseases and Related Health Problems) 10th Revision, World Health Organization, 2010.
http://apps.who.int/classifications/icd10/browse/2010/en

Substance Death ICD List
ICD Description and Code
Alcohol: Mental and behavioural disorders due to use of alcohol, (ICD F10)
Opioids: Mental and behavioural disorders due to use of opioids, (ICD F11)
Cannabinoids: Mental and behavioural disorders due to use of cannabinoids, (ICD F12)
Sedatives Or Hypnotics: Mental/behavioural disorders due to use of sedatives or hypnotics, (ICD F13)
Cocaine: Mental and behavioural disorders due to use of cocaine, (ICD F14)
Stimulants: Mental and behavioural disorders due to use of other stimulants, (ICD F15)
Hallucinogens: Mental and behavioural disorders due to use of hallucinogens, (ICD F16)
Tobacco: Mental and behavioural disorders due to use of tobacco, (ICD F17)
Psychoactive: Mental & behavioural disorders due to multiple drug use & use of other psychoactive substances, (ICD F19)
Degeneration of nervous system due to alcohol, (ICD G31.2)
Alcoholic polyneuropathy, (ICD G62.1) Polyneuropathy due to other toxic agents, (ICD G62.2)
Alcoholic myopathy, (ICD G72.1)
Myopathy due to other toxic agents, (ICD G72.2)
Alcoholic cardiomyopathy, (ICD I42.6)
Cardiomyopathy due to drugs and other external agents, (ICD I42.7)
Respiratory conditions due to chemicals, gases, fumes and vapours (ICD J68)
Respiratory conditions due to unspecified external agent, (ICD J70.9)
Alcoholic gastritis, (ICD K29.2)
Alcoholic liver disease, (ICD K70)
Alcohol-induced acute pancreatitis, (ICD K85.2)
Alcohol-induced chronic pancreatitis, (ICD K86.0)
Newborn affected by maternal use of tobacco (ICD P04.2)
Newborn affected by maternal use of alcohol, (ICD P04.3)
Newborn affected by maternal use of drugs of addiction, (ICD P04.4)
Fetal alcohol syndrome (dysmorphic), (ICD Q86.0)
Finding of alcohol in blood, (ICD R78.0)
Contact with steam and hot vapours, (ICD X13)
Poisoning: nonopioid analgesics, antipyretics and antirheumatics (ICD X60 X40 Y10)
Poisoning: antiepileptic, sedative-hypnotic, antiparkinsonism & psychotropic drugs, not elsewhere classified (ICD X61 X41 Y11)
Poisoning: narcotics & psychodysleptics [hallucinogens], not elsewhere classified (ICD X62 X42 Y12)
Poisoning: other drugs acting on the autonomic nervous system (ICD X63 X43 Y13)
Poisoning: other and unspecified drugs, medicaments and biological substances (ICD X64 X44 Y14)
Poisoning: alcohol (ICD X65 X45 Y15)
Poisoning: organic solvents and halogenated hydrocarbons and their vapours (ICD X66 X46 Y16)
Poisoning: other gases and vapours (ICD X67 X47 Y17)
Poisoning: pesticides (ICD X68 X48 Y18)
Poisoning: other and unspecified chemicals and noxious substances (ICD X69 X49 Y19)
Assault by drugs, medicaments and biological substances, (ICD X85)
Assault by gases and vapours, (ICD X88)
Assault by steam, hot vapours and hot objects, (ICD X98)
Contact with steam, hot vapours and hot objects, undetermined intent, (ICD Y27)
Opioids and related analgesics, (ICD Y45.0)
Hydantoin derivatives, (ICD Y46.2)
Sedatives, hypnotics & antianxiety drugs [Barbiturates, Benzodiazepines, Cloral derivatives, etc.] (ICD Y47)
Anaesthetics and therapeutic gases (ICD Y48)
Psychotropic drugs, not elsewhere classified (ICD Y49)
Drug or medicament, unspecified, (ICD Y57.9)
Example fo what happened in Michigan - what changed?  Barriers that once protected people were removed.   Did any of the people drafting the medicinal or recreational bills pray to God for wisdom before drafted or proposed it?  What can we do to rectify, put safety back into the situation, protect teens and vulnerable.
Vaping and recreational marijuana were not needed in the past, families did well without them.  Michigan started suffering 2008 when medicinal marijuana and vaping came to town with lax safety regulations.  Recreational destroys young people and leaves Michigan is in a critical state without a process to implement safety.  Voters didn’t vote for this.
(1)       No Baseline Regulations:  potency regulations to use lowest THC 1-3 % to minimize addiction were not implemented.
(2)       No regulations to implement recovery when a need for potency increased:  Potency should not go past 3 %, going past 3 % THC is an indication addiction is occurring, this is an indication addiction is occurring instead of healing, the next step is detox, talking to a doctor to help patients to protected recovery to be prevent patients from reaching for substance during withdraw in the wake of deadly substances infiltration.
(3)       No regulations to prohibit marketing drug dealing, instituted extreme over-prescribing without notifying voters of risks:  Marijuana groups marketing drugs on social media and news ads.  It is wrong to promote selling mind-altering substances - it destroys people and counties.  When mind altering substances increase in an area - accidents, suicides, homelessness, runaways, prostitution, human trafficking, violence, theft, arrests and sicknesses increase due to the high/drunk deceiving effect a mind-altering substance has on a person.   Marijuana is a mind-altering substance.  remove Marketing of Mind Altering Substances on social media - cigarette deaths were moving down to non-existent until the surge of medicinal, recreational and vaping occurred, backed by tobacco companies, much of their marketing now done in news posts and social media.  Remove marketing mind-altering substances on social media.  https://truthinitiative.org/research-resources/tobacco-industry-marketing/what-do-tobacco-advertising-restrictions-look-today
(4)       No regulations to prohibit excessive use and no notification of danger to citizens:  .  Instituted a deadly practice "over-prescribing" without notifying counties and residents of dangers of polluting an area with mind-altering substances.   When mind altering substances increase in an area - accidents, suicides, homelessness, runaways, prostitution, human trafficking, violence, theft, arrests and sicknesses increase due to the high/drunk deceiving effect a mind-altering substance has on a person.
(5)       No regulations to follow safe medical practice guidelines, recreational took doctors out of the process –  Doctors no longer prescribe, eliminated medical safety, it is no wonder people are strung out on drugs and homeless, can’t think straight because regulations that protect the young, old, special needs were eliminated.
(6)       Did not institute strict safety processes, instead jumped on dangerous over-prescribing and sold near schools, recovery centers and hospitals instead of institution tight lids to keep poisons securely locked 20 miles away from any hospital, recovery center, school or university.. https://www.mlive.com/news/2019/09/why-is-vaping-so-bad-for-teenagers.html
(7)       Lack of regulations protecting the vulnerable and lowly: Vape shops, dispensaries and recreational shops should never be allowed within 20 miles of schools, hospitals or recovery centers - where are the regulations that protect vulnerable people in Michigan? A Medicinal marijuana site went up near young people at U of M, which should never be allowed, see link below!! Vape shops, dispensaries should never be allowed within 20 miles of schools, hospitals or recovery centers. https://www.mlive.com/news/ann-arbor/2018/09/another_marijuana_dispensary_t.html

(8)       Lack of regulations to prevent drug dealing "marketing drugs". Recent news articles promote marijuana, a mind-altering substance, setting up young people in the area for hurt, deception and misery. Marketing mind-altering substances is wrong and deceiving.  Instead of keeping a lid on mind-altering substances, it is breaking all previously set lids to keep teens and adults safe.  The whole article is about making money off of people in a deceptive way - not mentioning their main product, Marijuana THC addiction potency increased  317% in a 0.5 gram joint between 1990 and 2013.  THC is the addictive part that gets a person high.  NIDA indicates the potency of a marijuana cigarette increased from 3 percent THC in 1990's to 12.5 percent THC in 2013, see marijuana notes below.  For example, vodka is way more addictive potent than beer, heroin more addictive potent than Tylenol #3.  Marijuana has concentrated product like those, the article doesn’t warn people of danger.  It doesn’t warn people about the dangers of alcohol and THC doubling addiction.  It doesn’t list the cost to insurance companies who pay for accidents and recovery related to addiction.  Marijuana and tobacco are not the only substances that are vaped. There are very poisonous addictive, deadly substances in the young crowd, marijuana is a gateway to these drugs.  Remove marijuana from teen population, you remove a method for teens stepping into deadly opiates, meth, cocaine, etc.   https://www.freep.com/story/news/marijuana/2019/12/21/michigan-marijuana-gift-guide-recreational-legal/2710324001/  

Cannabis & Opioid Use Disorder Early initiation of marijuana (before 18 years) emerged as the dominant predictor. Prohibiting marijuana before age 34 years old is an effective strategy in preventing opioid addiction in young adults https://www.ncbi.nlm.nih.gov/pubmed/31962227

Death and Population Source: Centers for Disease Control and Prevention, National Center for Health Statistics. Dataset: Underlying Cause of Death. 1999-2017 on CDC WONDER Online Database, released December, 2018. Data from the Multiple Cause of Death Files, 1999-2017, as compiled from data provided by the 57 vital statistics jurisdictions through the Vital Statistics Cooperative Program. CDC source data, but not a CDC publication. Data Accessed at http://wonder.cdc.gov/ and https://wonder.cdc.gov/ucd-icd10.html

Copyright information
Permission is given to print and share this report to support education and health of people, free of charge. When you share or print, suggested citation includes source, facebook page and blog.  

Resources –Seeking Help
Medical Emergency Call 911
Suicide Prevention Lifeline http://www.suicidepreventionlifeline.org
Suicide Prevention Lifeline 1-800-273-TALK
Suicide Prevention Lifeline 1-800-273-8255
Suicide Prevention Lifeline for Deaf; hard of hearing 1-800-799-4889
Intervene If you suspect your child is using drugs   http://www.drugfree.org/intervene
Treatment Locator – National listing by SAMHSA and Referral Hotline (SAMHSA) 1-877-SAMHSA-7a
Call: 1-800-273-8255

24 Hour Toll Free Prayer Lines
Daystar 1-800-329-0029
National Prayer Center Assemblies of God 1-800-477-2937
Christian Broadcasting Network (700 Club) 1-800-759-0700

Common Ground:  (248) 456-8144 (24 hours/day)  Families and friends can ask questions at common ground number, it is often a hard emotional time, they help family and friends guide loved ones into treatment or detox (coming off a mind-altering substance is hard, it can temporarily make a person feel suicidal, which is why protected recovery detox is important, to have support during withdraw and to build recovery support.  Some people have a hard time sleeping during early recovery, this is another reason for addiction treatment recovery, so a person doesn't have to be responsible for work during withdraw.  Some mind-altering substances require tapering off slowly with medical support for safe detoxification withdraw to reduce risk of harm (e.g., seizures, hallucinations, etc.)  these are alcohol, opiates, benzodiazepines, methamphetamine, oxycontin, methadone or suboxone).    

Good low cost christian program is Life Challenge, I believe they have scholarships for those who can not afford it, recovery is available, message Living in Grace, local community programs, local churches or hospitals, we can find scholarships to help people in https://lcministries.org/ Phone: (313) 531-0111

Young parents are often afraid to talk about the need for recovery, afraid they will loose custody of children, that is no longer true. Progams like Odyssey Village allow young children and parents in, both mom, or dad or both attend. Parents are in separate housing during the program to keep recovery as the prime focus.  Odyssey Village odysseyvillage.com/ Phone: (810) 238-5888

Responsibility:  
Young people are a blessing and are made to live. Losing young people in the land in which we live is devastating, we must never forget those we lost and keep moving forward to prevent the next generation from stumbling into this situation.  When young deaths rise, a critical situation is occurring, as responsible citizens, we can find ways to support critical populations, support the young, elderly and the lowly.  We can investigate what is happening, have any laws changed in an area that could affect the health of people.  

Greatest Commandment:  Matthew 22:35-40
35 Then one of them, which was a lawyer, asked him a question, tempting him, and saying, 36 Master, which is the great commandment in the law? 37 Jesus said unto him, Thou shalt love the Lord thy God with all thy heart, and with all thy soul, and with all thy mind. 38 This is the first and great commandment. 39 And the second is like unto it, Thou shalt love thy neighbor as thyself. 40 On these two commandments hang all the law and the prophets. 

Parents indicated reporting was needed to support young people, they were right, U.S. report revealed young adults ages 25-34 years old in the experienced critical horrible significant 21.6% death increase in the recent five years - - - - - 46,613 more deaths in the recent five year span versus prior five years, 2013-2017 vs 2008-2012, this is a terrible, critical increase in young deaths.  We must determine to support life, support sober-minded life, tell the truth about the deceiving nature of mind-altering substances, help young and old people to recovery, support churches, recovery centers, prisons, support sober-minded laws and sobriety education in schools. To see mind-altering substance reports go here lhttps://hiskingdomwematter.blogspot.com/p/us-age-25-34-year-old-substance-deaths.html or see link at bottom of this report page.

The first step to changing a situation is to admit the situation exists, addiction exists, mind-altering substances can cause misery and tragic early death if addiction sets in without recovery support. The good news is we have a God who saves,   Deuteronomy 6 indicates God commands us to teach children about when God saved the nation Israel, millions of people with no phones, no computers - God heard the cries and prayers of the people, he saved. God commands us to teach children keep these words in our heart, teach them diligently when sitting in the house, when walking out of the house or in the house, when thou liest down and when thou risest up. God is saying, keep the words, memorize them, never forget them, keep them close in mind, daily. God so loves us and our children, he gave us these words to save and teach these words to be saved. https://www.kingjamesbibleonline.org/Deuteronomy-Chapter-6/

Understanding death increase enables us locate critical suffering populations to work on sober-minded solutions to give support.  Living in Grace created these reports to improve the health and well-being of persons living in the United States. Recovery and sobriety works.  Living in Grace shares reporting to support work with governments, schools, places of worship, community groups, universities, colleges, hospitals, police, fire departments, EMS and businesses to help those suffering to recovery, support those in prison and prevent the next generation of children from stepping into the horrible substance situation.

Contact:  Phone:  Please join us in supporting good health of all people call 248-392-8676 or email hismatter@gmail.com or join us at
Mind-Altering-Substance Reports: https://HisKingdomWeMatter.blogspot.com/
Mind-Altering-Substance Reports old: the link below works if you replace the ^^^" with a period dot "."  Facebook blocked the reports again, some reports are still here until we move them to the site listed above, in the meantime replace ^^^ with a "."  https://hisgracematters^^^blogspot.com/p/us-substance-deaths-2013-2017-5-year.html
Crude_Death_Reports: https://HisKingdomNumbersMatter.blogspot.com
Crude_Death_Reports_Old:  the link below works if you replace the ^^^" with a period dot "."  Facebook blocked the reports again, some reports are still here until we move them to the site listed above, in the meantime replace ^^^ with a "."   https://HisGraceMattersCommunityNumbersMatter^^^blogspot.com/